This report provides a snapshot of differences in educational attainment throughout Georgia and earnings differences by education level, highlighting the role of higher education in economic mobility and outcomes. Higher education can help Georgia fill workforce gaps and empower Georgians to transform their lives, improve their earnings and career opportunities and contribute more to their communities and the economy. Yet public policy must also overcome historic and systemic barriers that created inequity in opportunities. The Georgia Higher Education Data Book provides insights into the diversity of Georgia’s colleges and students and the state’s approach to public higher education. This report will help you better understand the students in Georgia’s colleges, how Georgia funds higher education and how students pay for college. You can download all of the charts used in the data book here.
Education Levels and Benefits of College
Georgia boasts the distinction of being the first state to create a publicly funded college in the United States. The original charter for the University of Georgia in 1785 recognizes a secure, prosperous and democratic society as a critical public benefit of higher education, saying “the common wishes of the People become the Laws of the Land, their public prosperity and even existence very much depends upon suitably forming the minds and morals of their Citizens.”[1]
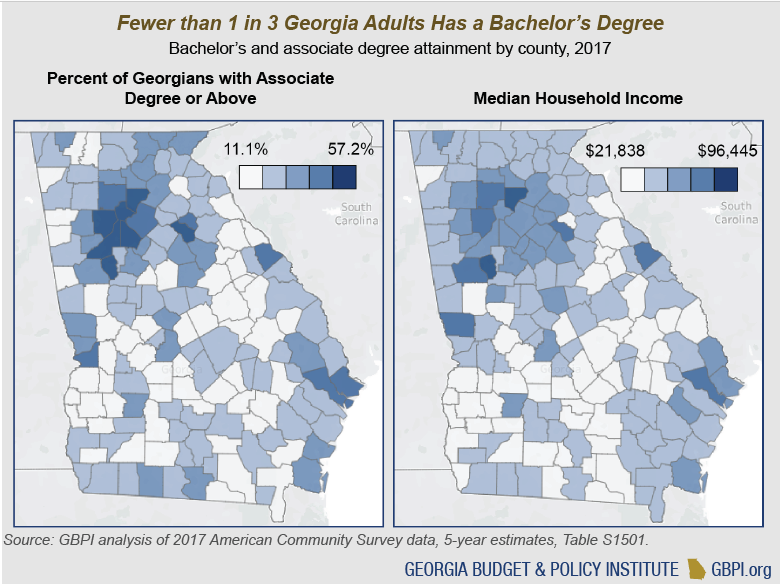
In Georgia, 31 percent of adults age 25 and over have a bachelor’s degree or above. Thirty-nine percent have an associate degree or above. Postsecondary attainment varies by county. Attainment rates are highest in metro Atlanta counties, where about 50 percent of adults have bachelor’s degrees, and lowest in rural areas. In about half of Georgia’s counties, fewer than one in five adults have a college degree.[2]
Today, most Georgians who want to live financially secure and independent lives will need a postsecondary degree or credential. As the economy changes and grows, a college credential is more important for today’s working Georgian than for past generations.
 Historic Inequities Lead to Unequal Attainment
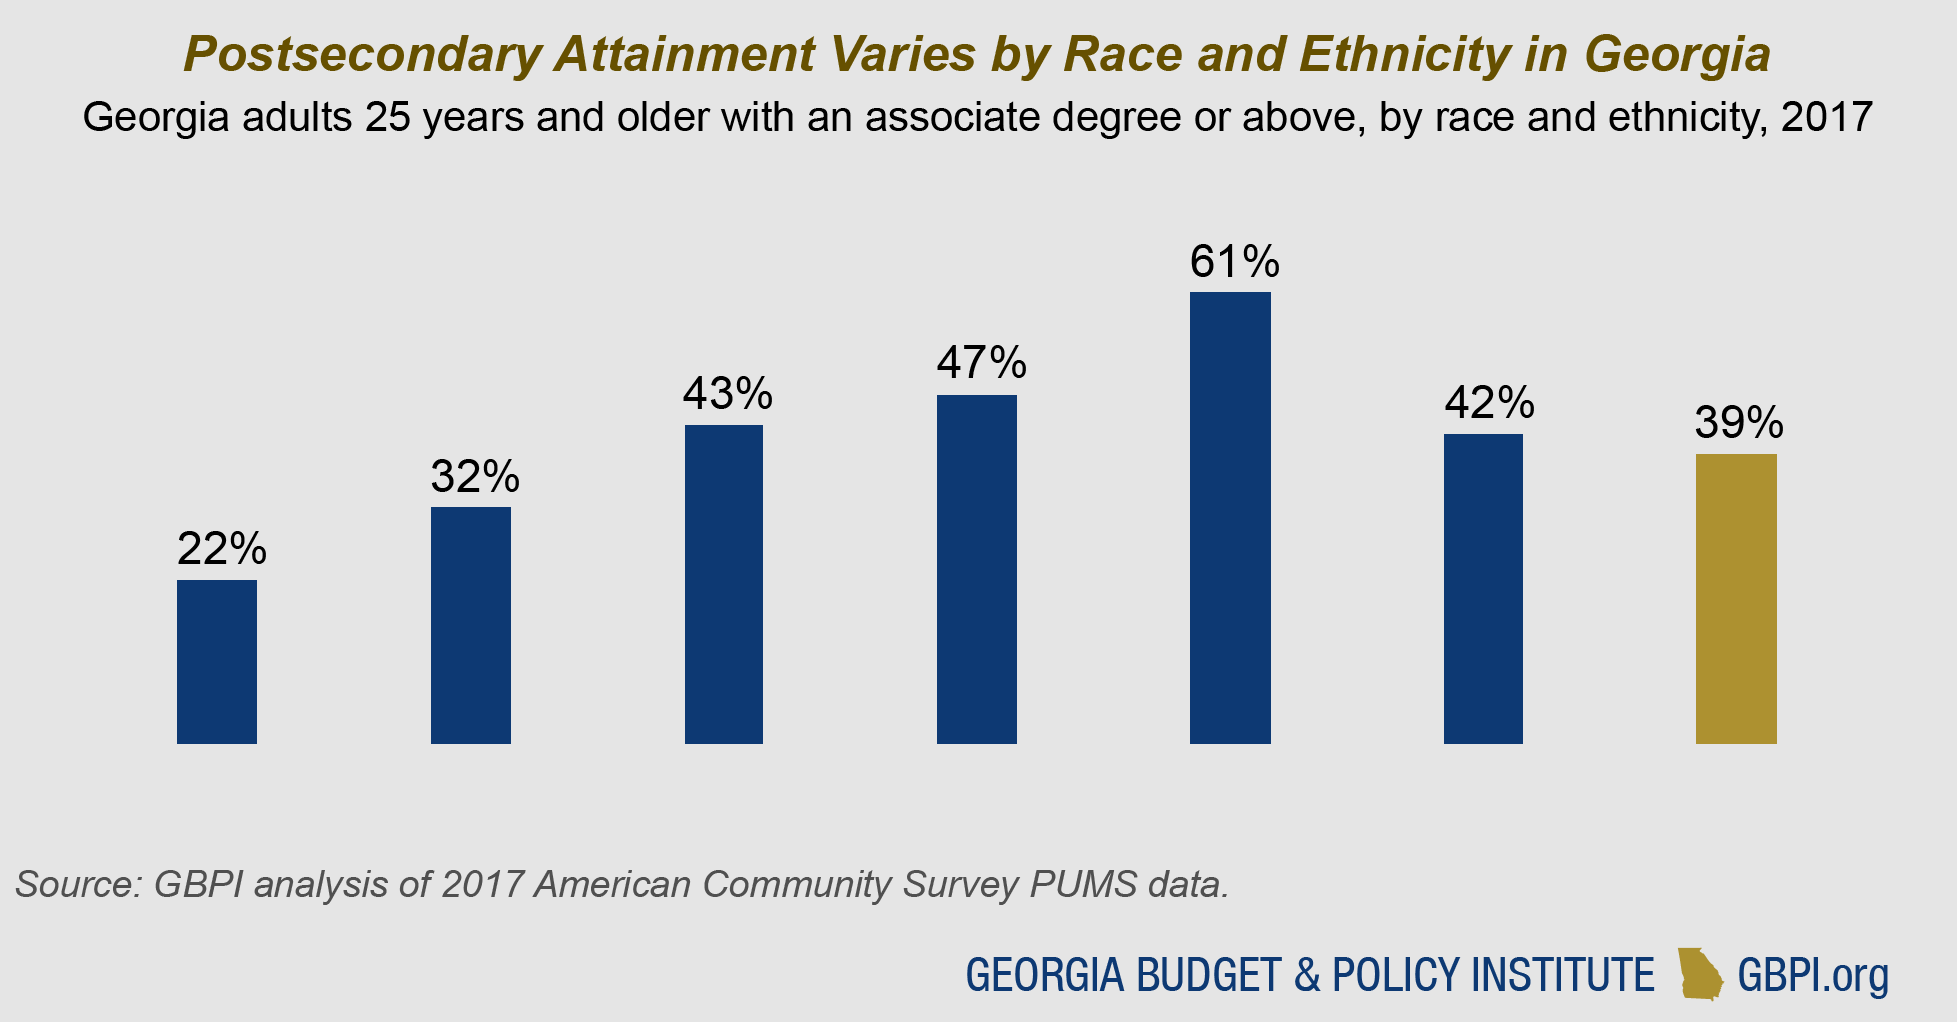
In addition to geographic differences, large racial and ethnic differences exist in postsecondary educational attainment in Georgia. Overall, about four in 10 Georgians older than 25 have an associate or bachelor’s degree. The share is closer to two in 10 for Latino Georgians and three in 10 for African-Americans. About six in 10 Asian American and Pacific Islanders have an associate degree or above, the highest rate of attainment of any racial or ethnic group.[3]
While students of all races and ethnicities aspire to go to college, not all Georgia students have the resources they need to graduate from these institutions. Students enter college after years of inequitable educational opportunities in early childhood, elementary and secondary schools. Wide racial and ethnic disparities in wealth, income and health create challenges to going to college and finishing a degree.[4]
Though the state is proud of its long history of public higher education, for much of that history its most well-resourced and prestigious colleges were closed to African Americans. Amid racial segregation, black Georgians created their own colleges and universities, which are today known as historically black colleges and universities (HBCUs). The University of Georgia and Georgia Tech admitted their first black students in 1961, after a federal district court judge ordered the integration of the universities following resistance from the state legislature. The university system continued to negotiate desegregation plans with the federal government during the 1970s and 1980s.[5]
 Higher Education Benefits Individuals and Society
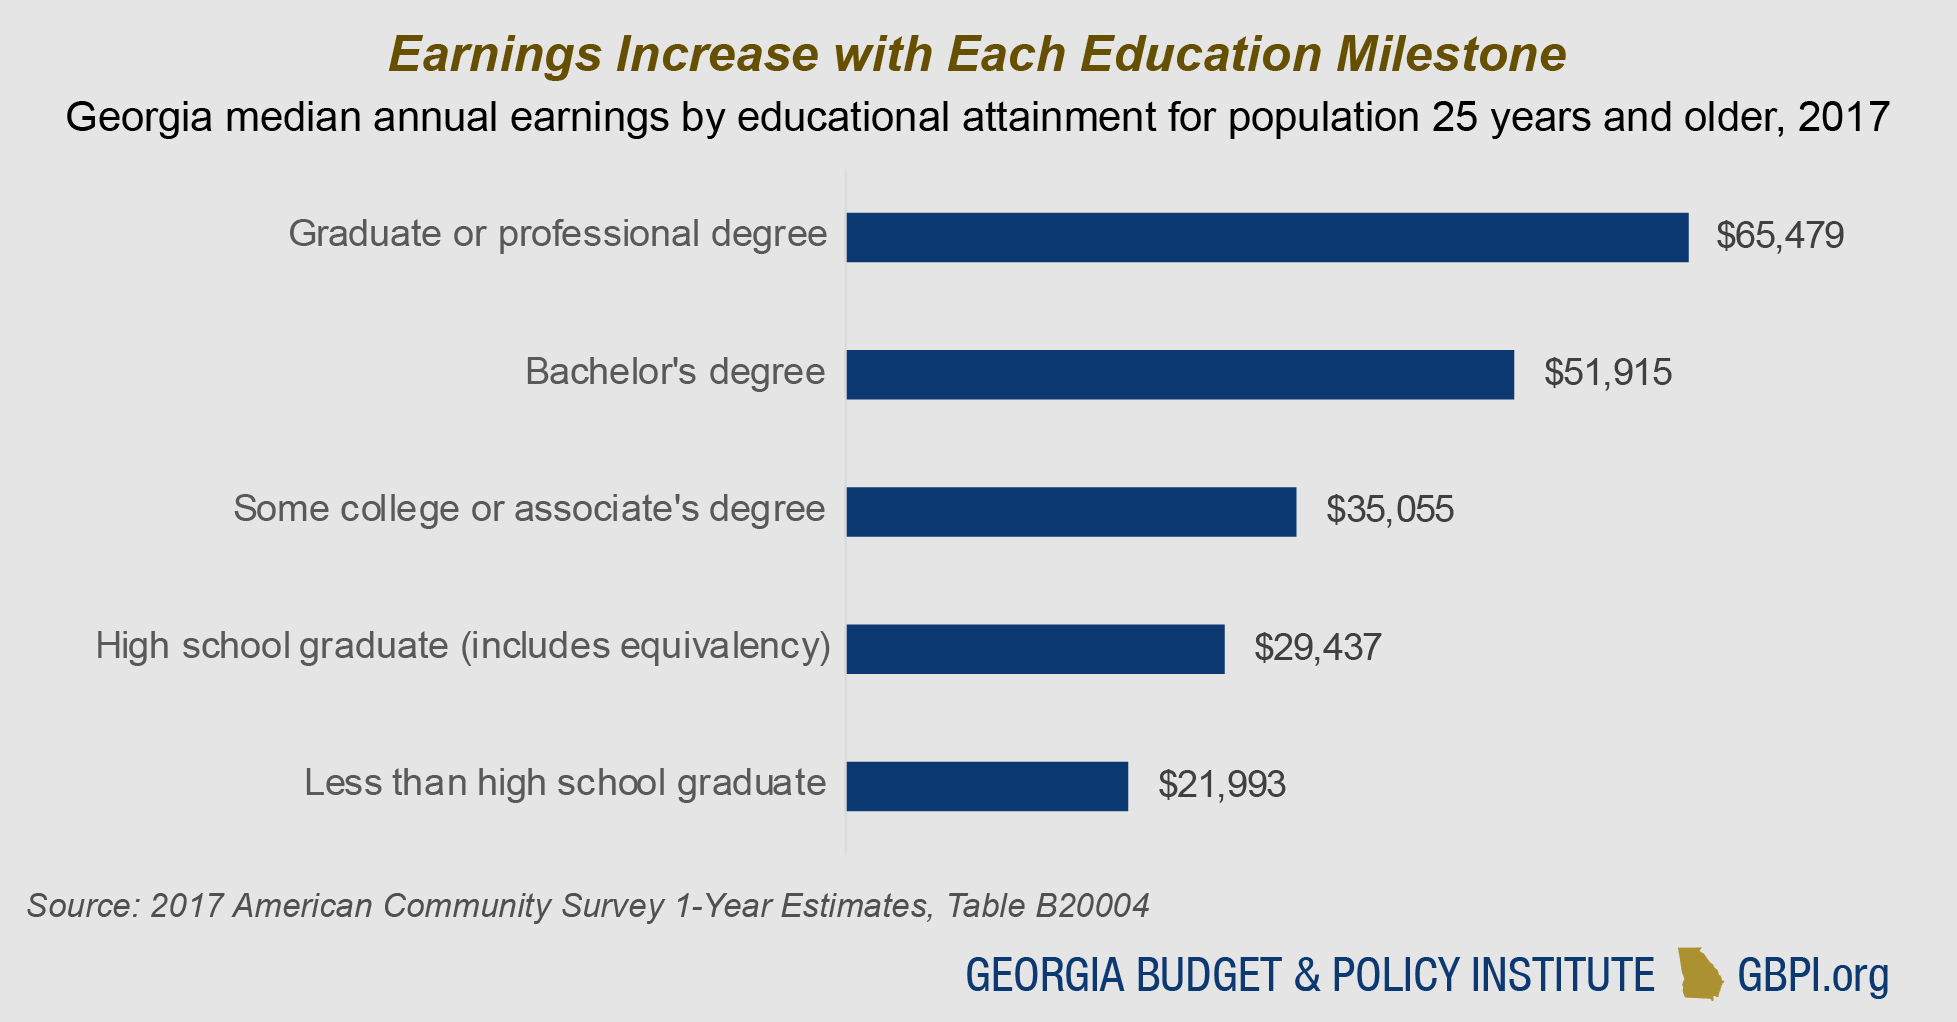
Georgians can expect to earn more with each level of education completed. High school graduates earn more than people without high school diplomas, associate degree holders earn more than high school graduates, and people with bachelor’s degrees earn even more. For example, median income in Georgia for someone with a bachelor’s degree is 48 percent higher than for someone with some college or an associate degree, and median income for someone with a graduate or professional degree is 26 percent higher than for someone with a bachelor’s degree.[6]
 Educational attainment affects more than income. Individuals with higher education levels experience better health outcomes and longer life expectancies, and parents’ education levels also affect their children’s health and education. Communities with higher levels of education experience less crime, lower rates of incarceration and greater participation in school, community, service, civic and religious organizations. Education beyond high school increases the likelihood of voting, volunteering and charitable giving.[7]
Public colleges also benefit graduates by creating opportunity and helping individuals move up the economic ladder. Students from families with lower incomes tend to earn salaries similar to their higher-income classmates after graduation.[8] But the schools most effective at boosting incomes for students from lower-income families tend to serve small numbers of these students. Instead, technical colleges and historically black colleges and universities in particular played an important role in economic mobility in Georgia. Many of the Georgia colleges that propelled the most students from the lower 60 percent of household incomes to the upper 40 percent of household incomes were public or private HBCUs that served larger shares of students from lower-income backgrounds. [9] Technical colleges also effectively moved students up the income ladder. Public HBCU students moved up on average 11 percentile points, while the average change in other public colleges was very small.[10]
Finally, a college degree can help protect individuals against the negative effects of economic cycles. During the Great Recession, individuals without college degrees were more vulnerable to job loss and lower earnings, and most jobs created during the economic recovery require a bachelor’s degree or higher.[11]
Though an individual does not need a college education to live a meaningful and fulfilled life, the economy highly values a college degree. Employer demand for college-educated workers exceeds the supply. And protections for non-college-educated workers, like unions and collective bargaining agreements, have weakened so that economic prospects are worse for those without a college degree.[12]
Earnings Benefits Differ by Gender, Race and Ethnicity
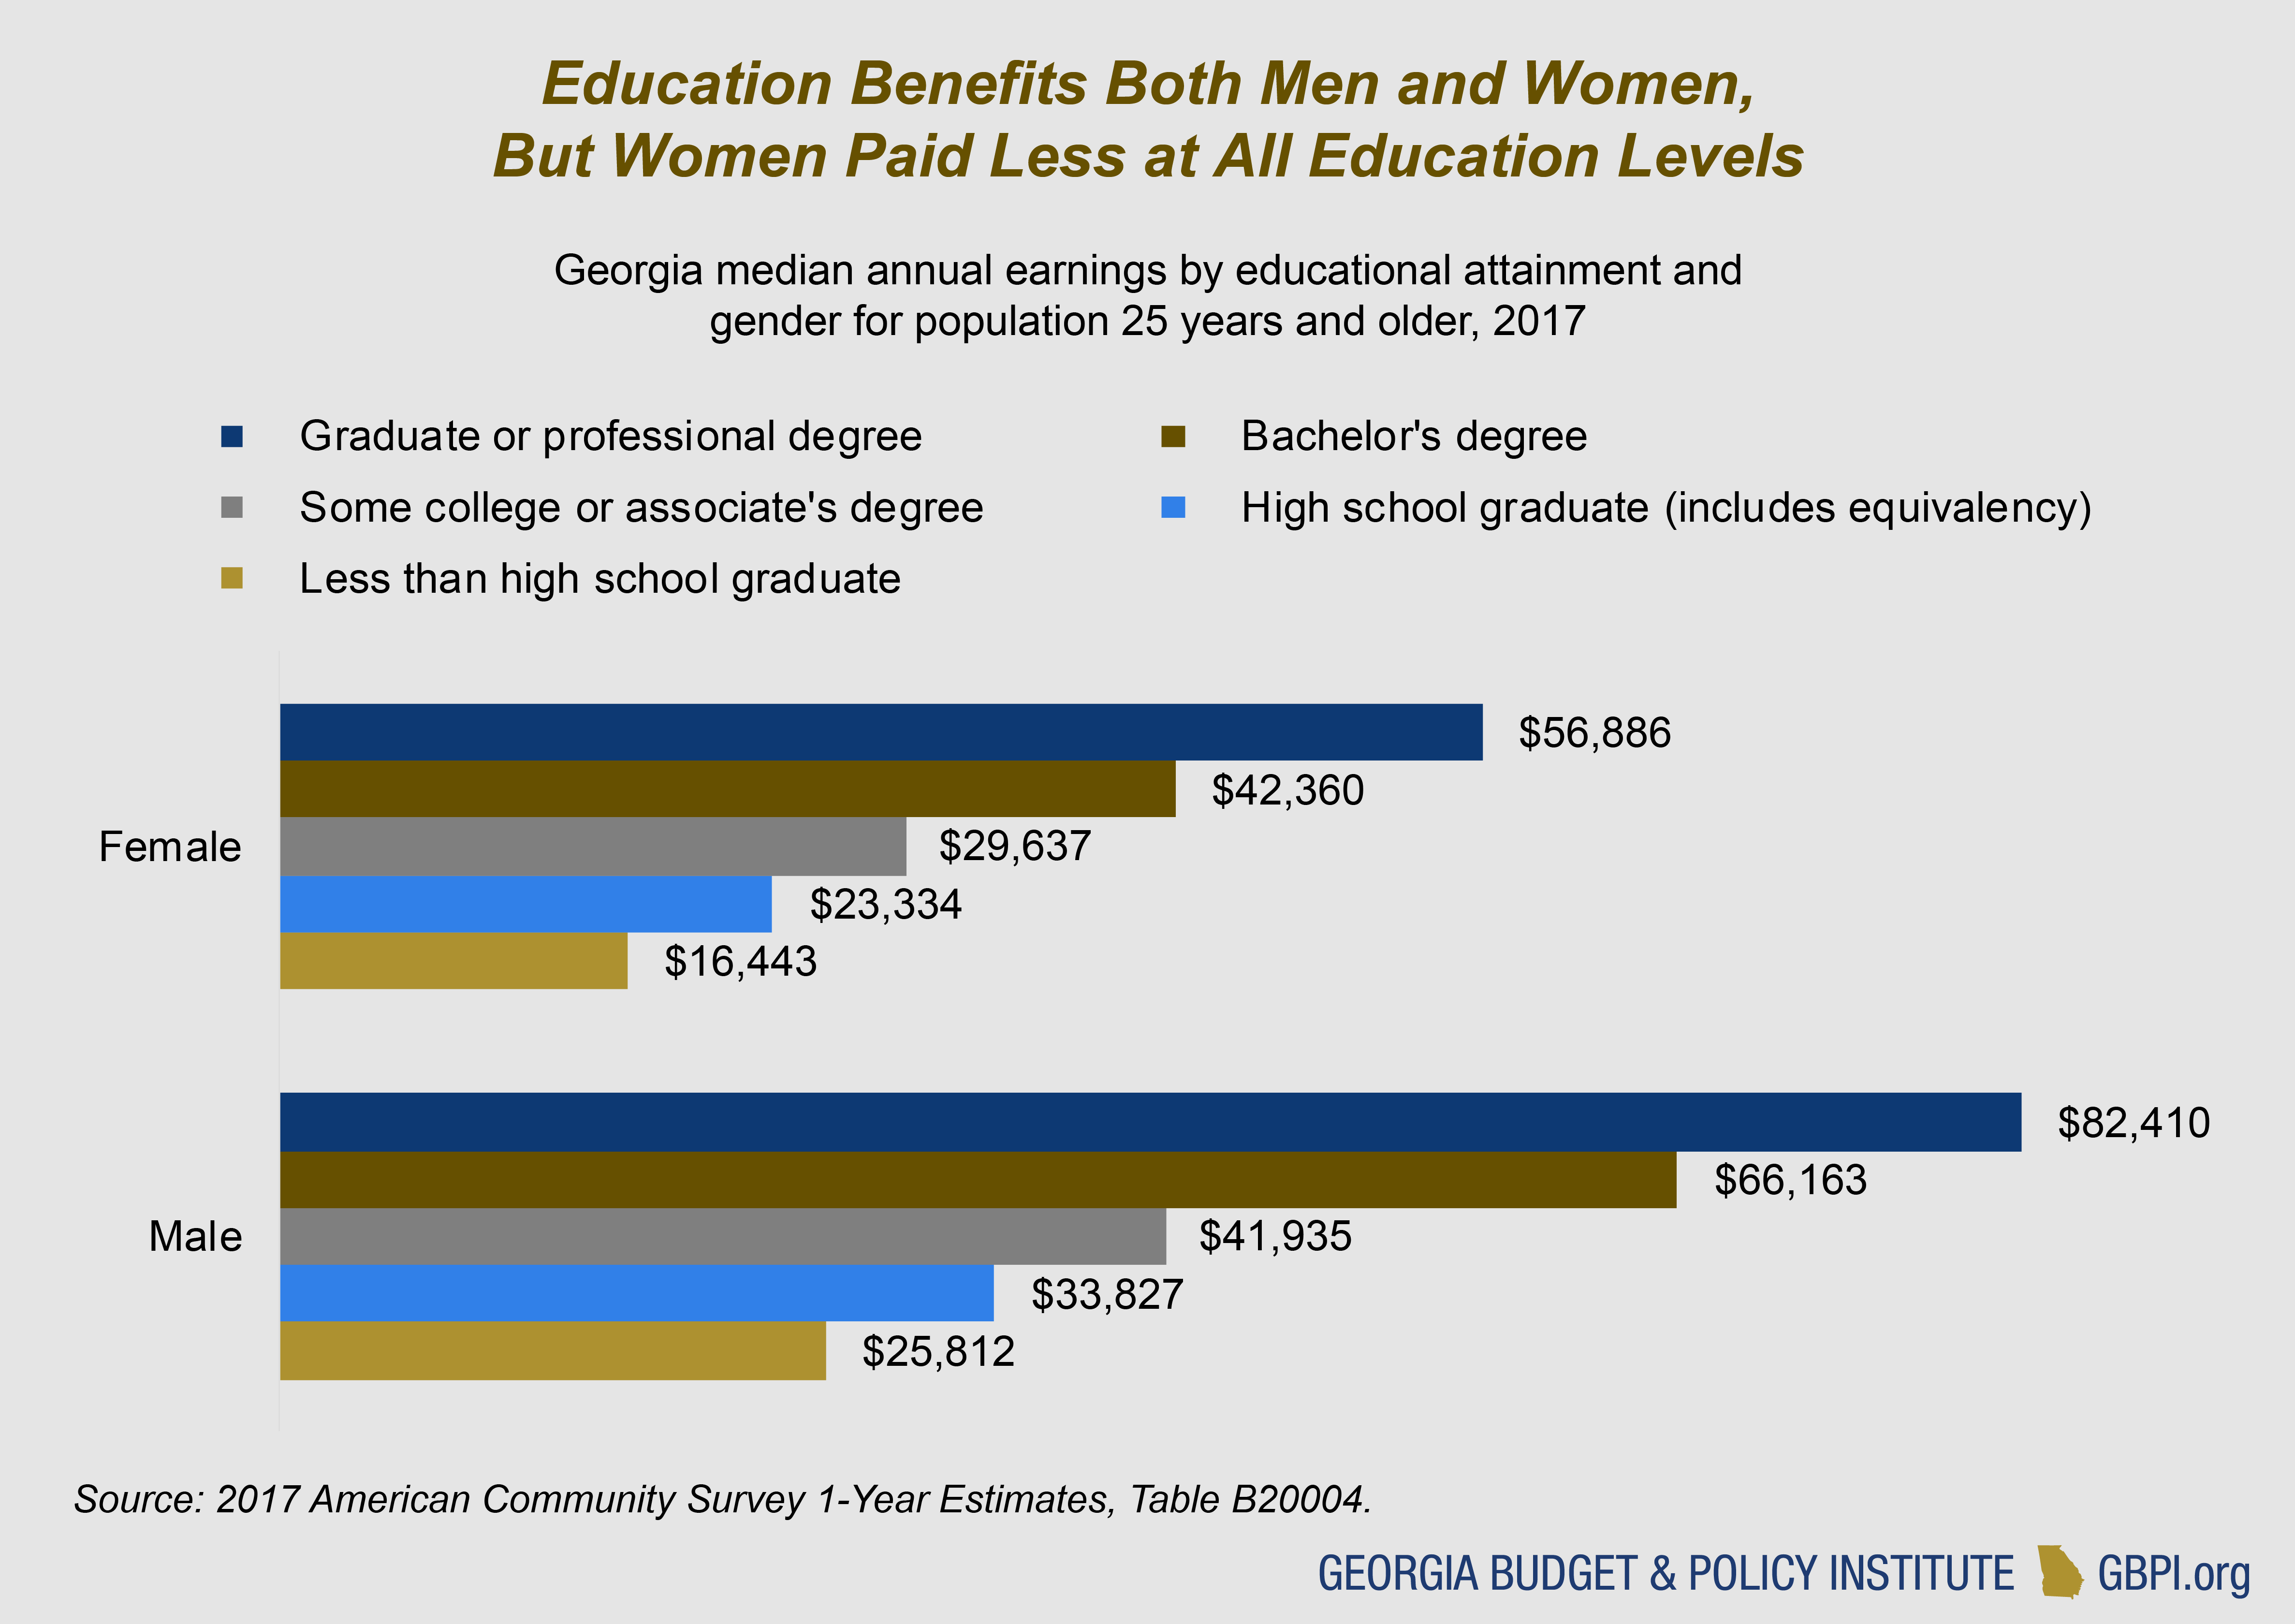
Both women and men earn more with higher education levels, but pay differences are clear. In general, women are paid less than men with similar education credentials. For example, the median annual earnings for women with a bachelor’s degree in Georgia is almost $24,000 less than men with bachelor’s degrees, or 56 percent less. Pay for women bachelor’s degree holders is similar to pay for men with an associate degree or some college. Median earnings for men with bachelor’s degrees in Georgia are higher than for women with graduate or professional degrees.[13]
 Many factors contribute to these differences, including pay differences between jobs that are held predominantly by men or predominantly by women, women’s greater responsibility for unpaid family work and job and workplace discrimination. While education creates opportunities for both women and men, it can be even more important for women to pursue postsecondary education because of these financial inequities. In fact, women’s increased education levels play a key role in narrowing wage gaps. [14] Today, women outnumber men in both the university and technical college systems.[15]
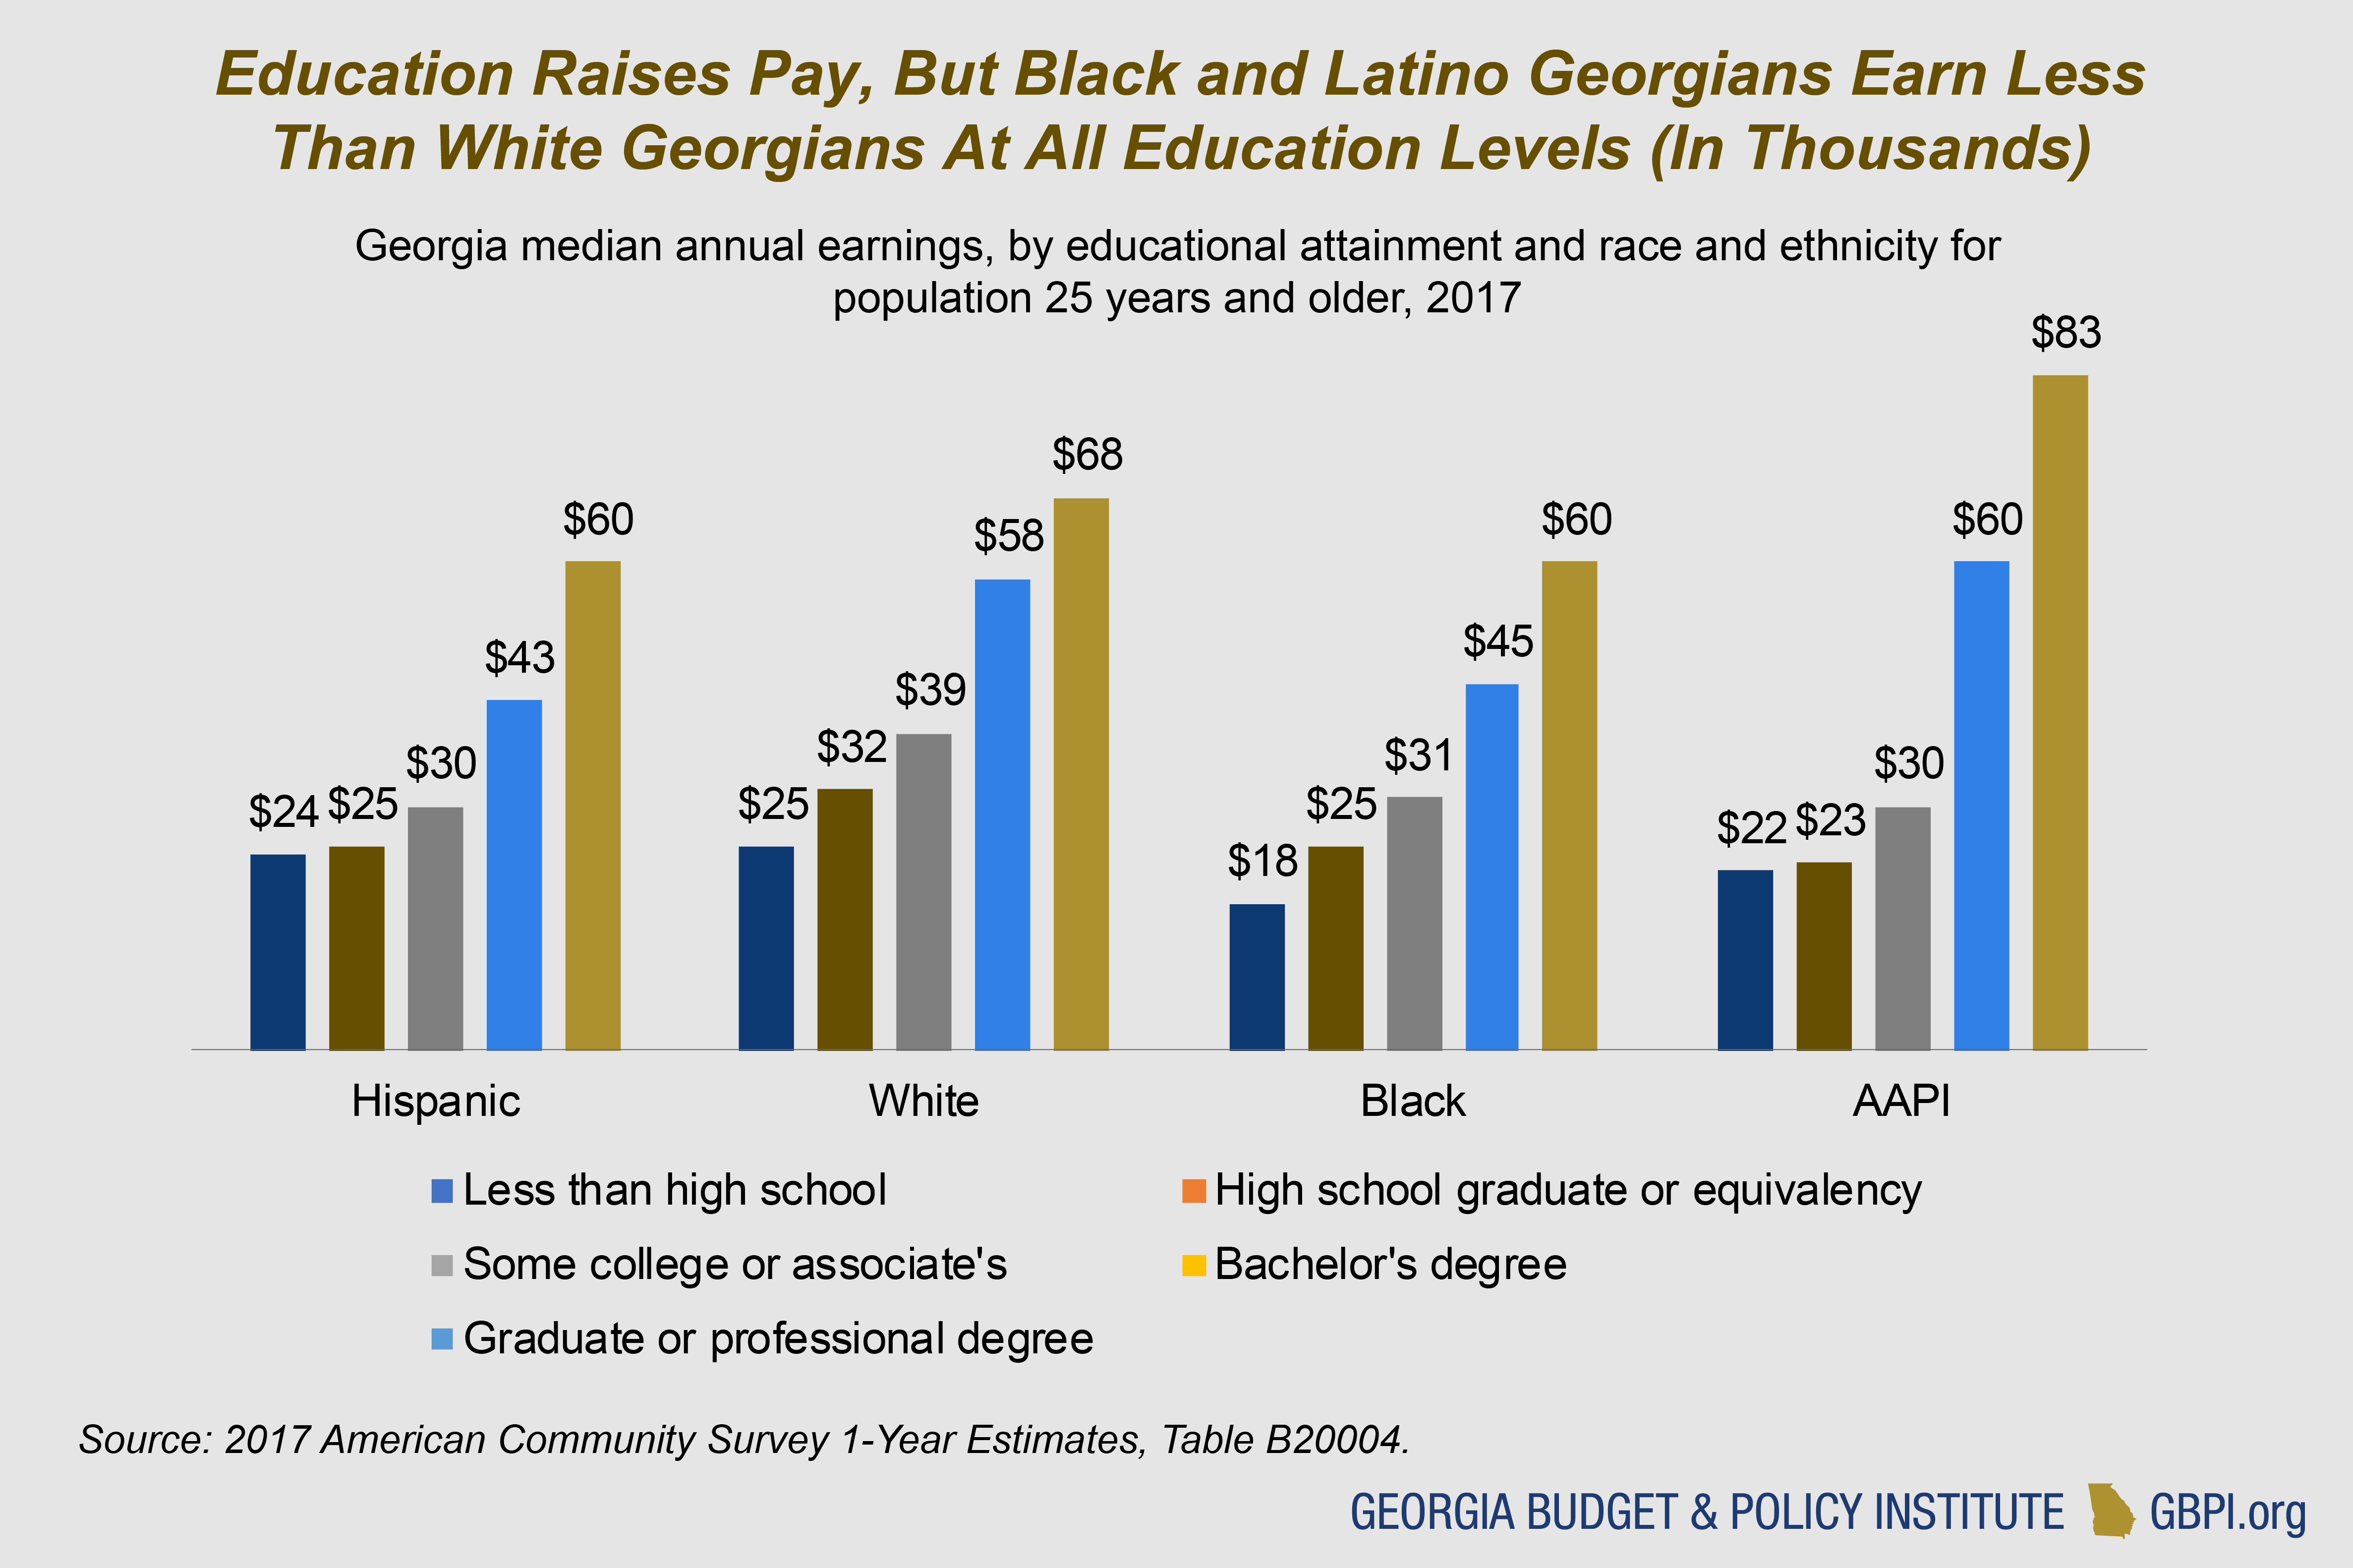
Similar patterns exist for earnings broken out by race and ethnicity. Bachelor’s degrees lead to large increases in pay for people of all races and ethnicities, but black and Latino Georgians are paid less than white Georgians with similar education credentials. For example, the median income for white Georgians with a bachelor’s degree is $58,000, compared to $43,100 for Latinos and $45,000 for African-Americans. Incomes for Asian American and Pacific Islanders (AAPI) range the widest by education. Incomes for AAPI Georgians without bachelors’ degrees are similar or lower than other non-white racial and ethnic groups, but AAPIs with bachelor’s degrees or above have the highest median incomes of all racial/ethnic groups.[16]

Student and School Characteristics and Graduation Rates
Georgia’s public college and university systems provide many options, ranging from shorter-term programs designed for specific work credentials or skills, like practical nursing licensure or welding, to an undergraduate liberal arts education, to doctoral research.
Public higher education in Georgia includes 49 schools across the university and technical college systems. The two systems together educate more than 460,000 students per year across diverse programs, including technical certificates, associate degrees, bachelor’s degrees and graduate credentials.
University System of Georgia: One System, A Variety of Schools
The university system includes 26 public colleges and universities with differing missions. In fall 2018, 328,712 students enrolled in a university system school. Georgia’s colleges and universities fall into four classifications, or sectors:
- Research universities: Doctoral-granting universities with high research activity
- Comprehensive universities: Universities with significant research activity, but with less emphasis than at research universities; graduate programs are masters dominant
- State universities: Primarily undergraduate and masters-level programs
- State Colleges: Associate degrees and bachelor’s degrees in select programs; no graduate programs
Since 2011, Georgia consolidated schools, both within and across sectors. Therefore, a school can have a primary classification while it serves multiple roles. For example, Georgia State University is a research university but serves a secondary function as a state college after its merger with Georgia Perimeter College.
Georgia is also home to three public historically black colleges and universities (HBCUs): Albany State, Fort Valley State and Savannah State universities. These school were established to educate black students whom the state barred from attending certain universities during the university system’s segregated past. Students of all races and ethnicities can and do enroll in these colleges, but they continue their historical mission to educate black students in Georgia.
University System of Georgia By Sector
| Research Universities | |
| University of Georgia | Georgia Institute of Technology |
| Augusta University | Georgia State University |
| Comprehensive Universities | |
| University of West Georgia | Valdosta State University |
| Kennesaw State University (merged with Southern Polytechnic State University in 2015) |
Georgia Southern University (merged with Armstrong State University in 2018) |
| State Universities | |
| Albany State University (HBCU, merged with Darton State College in 2017) | Georgia College & State University |
| Armstrong State University | Georgia Southwestern State University |
| Clayton State University | Middle Georgia State University (created from merger of Middle Georgia State College and Macon State College in 2013) |
| Columbus State University | Savannah State University (HBCU) |
| Fort Valley State University (HBCU) | University of North Georgia (created from merger of Gainesville State College and North Georgia College and State University in 2013) |
| State Colleges | |
| Abraham Baldwin Agricultural College (merged with Bainbridge State College in 2018) | Georgia Highlands College |
| Atlanta Metropolitan State College | Gordon State College |
| College of Coastal Georgia | East Georgia State College |
| Dalton State College | South Georgia State College (created from merger of Waycross College and South Georgia College in 2013) |
| Georgia Gwinnett College | |
Georgia’s college students largely reflect the racial and ethnic diversity of the state’s young adult population, though black students are still underrepresented. During their pre-college experiences, black students are more likely to experience challenges related to poverty, including poor health, low-quality early childhood education, high mobility rates and less participation in summer and after-school activities.[17] These challenges contribute to lower high school graduation and college enrollment rates. College prices that are too high for students from low-income families and a lack of adequate academic preparation also act as barriers to college enrollment. About half of undergraduates are white, 28 percent are black, 10 percent are Latino and 8 percent are Asian.[18]
 Though they remain in the minority, black, Latino and Asian students enroll in college in greater numbers every year, far outpacing population growth, while white student enrollment has declined. In the last 20 years:
- Black student enrollment grew 90 percent, compared to a 45 percent increase in black residents overall.
- Asian student enrollment grew 192 percent, compared to 162 percent overall growth.
- Latino student enrollment grew a stunning 606 percent, compared to 136 percent overall growth.
- White student enrollment grew 15 percent, compared to 19 percent overall growth.[19]
Georgia’s total population growth also depends on communities of color. The state projects that Georgia’s Latino and Asian populations will grow faster than its white and black populations. The state’s population is also shifting by geographic region. Population projections show Georgia’s young population will grow the most in the metro Atlanta area, north and west Georgia, and shrink in its rural counties in middle and southwest Georgia.[20] Population decline poses challenges for colleges in rural areas that have traditionally served students from nearby high schools.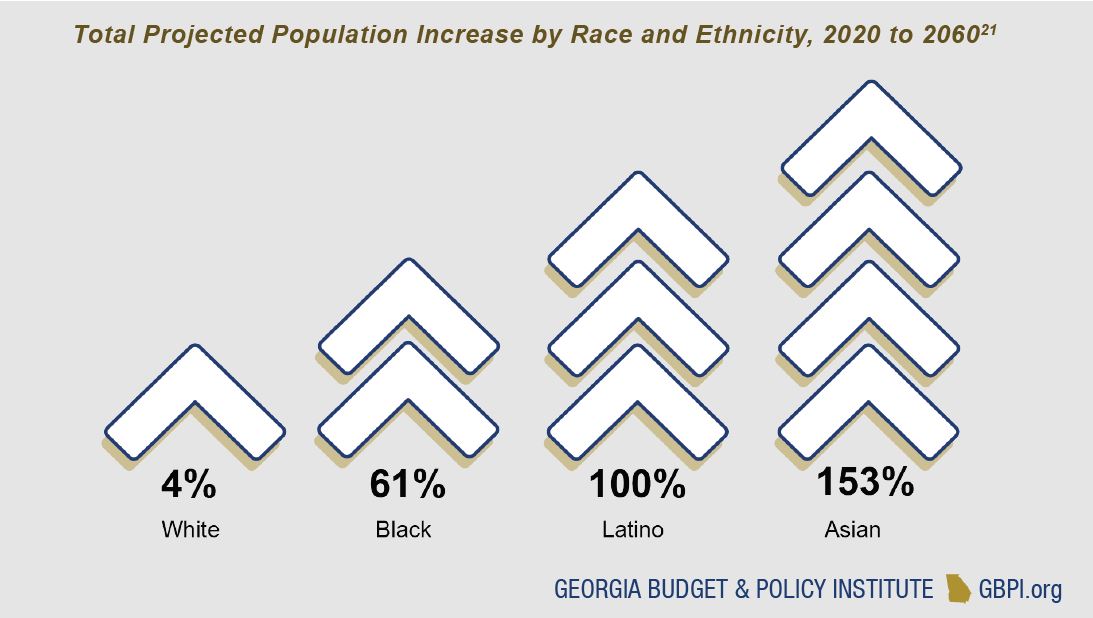 Finally, Georgia’s public college and university students reflect a range of family incomes. The median family income in Georgia is $68,000.[22] Though students from families who struggle to make ends meet enroll in every college in the university system, a clear split exists in Georgia’s public colleges. In three schools, the University of Georgia, Georgia College and State University and the Georgia Institute of Technology, the median family income is above $100,000. All remaining 23 institutions in the university system serve students with median family incomes of less than $68,000.[23]
 The wages students earn after graduation also differ by school. Available data shows median wages for associate degree holders five years after graduation range from $28,000 to $61,000 and for bachelor’s degree holders from $32,000 to $76,000.[24]
Students at different schools also differ by important characteristics that affect students’ experiences and graduation rates. For example, 27 percent of students in research universities attend part-time, while 40 percent of students in state colleges do. State university and state college students are more likely to be women or age 25 or older, compared to students in public research and comprehensive universities.[25] The state’s regional comprehensive universities educate the most students from rural areas. But rural students make up the highest percentage of students in state universities and state colleges.[26]
| % Part-Time | % Women | % Students from Rural Counties | |
| Research Universities | 27% | 52% | 7% |
| Comprehensive Universities | 27% | 56% | 16% |
| State Universities | 31% | 62% | 22% |
| State Colleges | 40% | 61% | 22% |
| University System – Total | 30% | 56% | 15% |
Source: University System of Georgia, Fall 2018 Semester Enrollment Report.
To see the top college choices of high school graduates from each school district, visit the Governor’s Office of Student Achievement High School Graduate Outcomes Data Dashboard.
| % Part-Time | % Women | % Students from Rural Counties | |
| Abraham Baldwin Agricultural College | 38% | 57% | 55% |
| Albany State University | 32% | 72% | 20% |
| Atlanta Metropolitan State College | 59% | 66% | 1% |
| Augusta University | 18% | 62% | 14% |
| Clayton State University | 43% | 70% | 4% |
| College of Coastal Georgia | 41% | 69% | 22% |
| Columbus State University | 36% | 60% | 20% |
| Dalton State College | 38% | 60% | 30% |
| East Georgia State College | 32% | 60% | 51% |
| Fort Valley State University | 15% | 62% | 18% |
| Georgia College & State University | 18% | 64% | 18% |
| Georgia Gwinnett College | 34% | 57% | 2% |
| Georgia Highlands College | 53% | 62% | 9% |
| Georgia Institute of Technology | 36% | 31% | 6% |
| Georgia Southern University | 21% | 56% | 26% |
| Georgia Southwestern State University | 34% | 67% | 31% |
| Georgia State University | 37% | 60% | 2% |
| Gordon State College | 35% | 68% | 28% |
| Kennesaw State University | 29% | 49% | 7% |
| Middle Georgia State University | 37% | 57% | 31% |
| Savannah State University | 16% | 61% | 11% |
| South Georgia State college | 36% | 65% | 64% |
| University of Georgia | 10% | 57% | 15% |
| University of North Georgia | 32% | 57% | 27% |
| University of West Georgia | 32% | 66% | 11% |
| Valdosta State University | 31% | 66% | 25% |
College Graduation Rates by Race, Ethnicity and Income
Policymakers are focused on boosting postsecondary educational attainment and improving college graduation rates. Georgia would have more college graduates if it changed policies and practices to tackle barriers for students from working-class families and “first-generation” students, or students who are the first in their families to go to college.
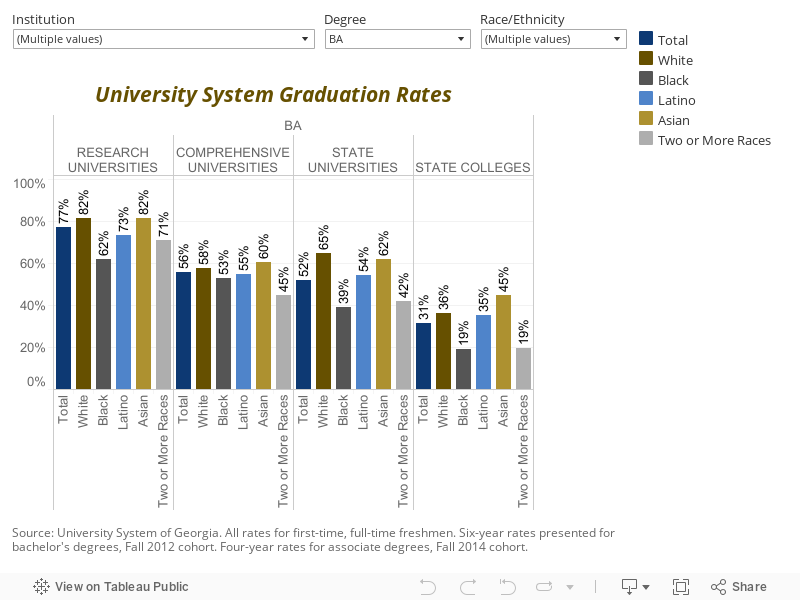
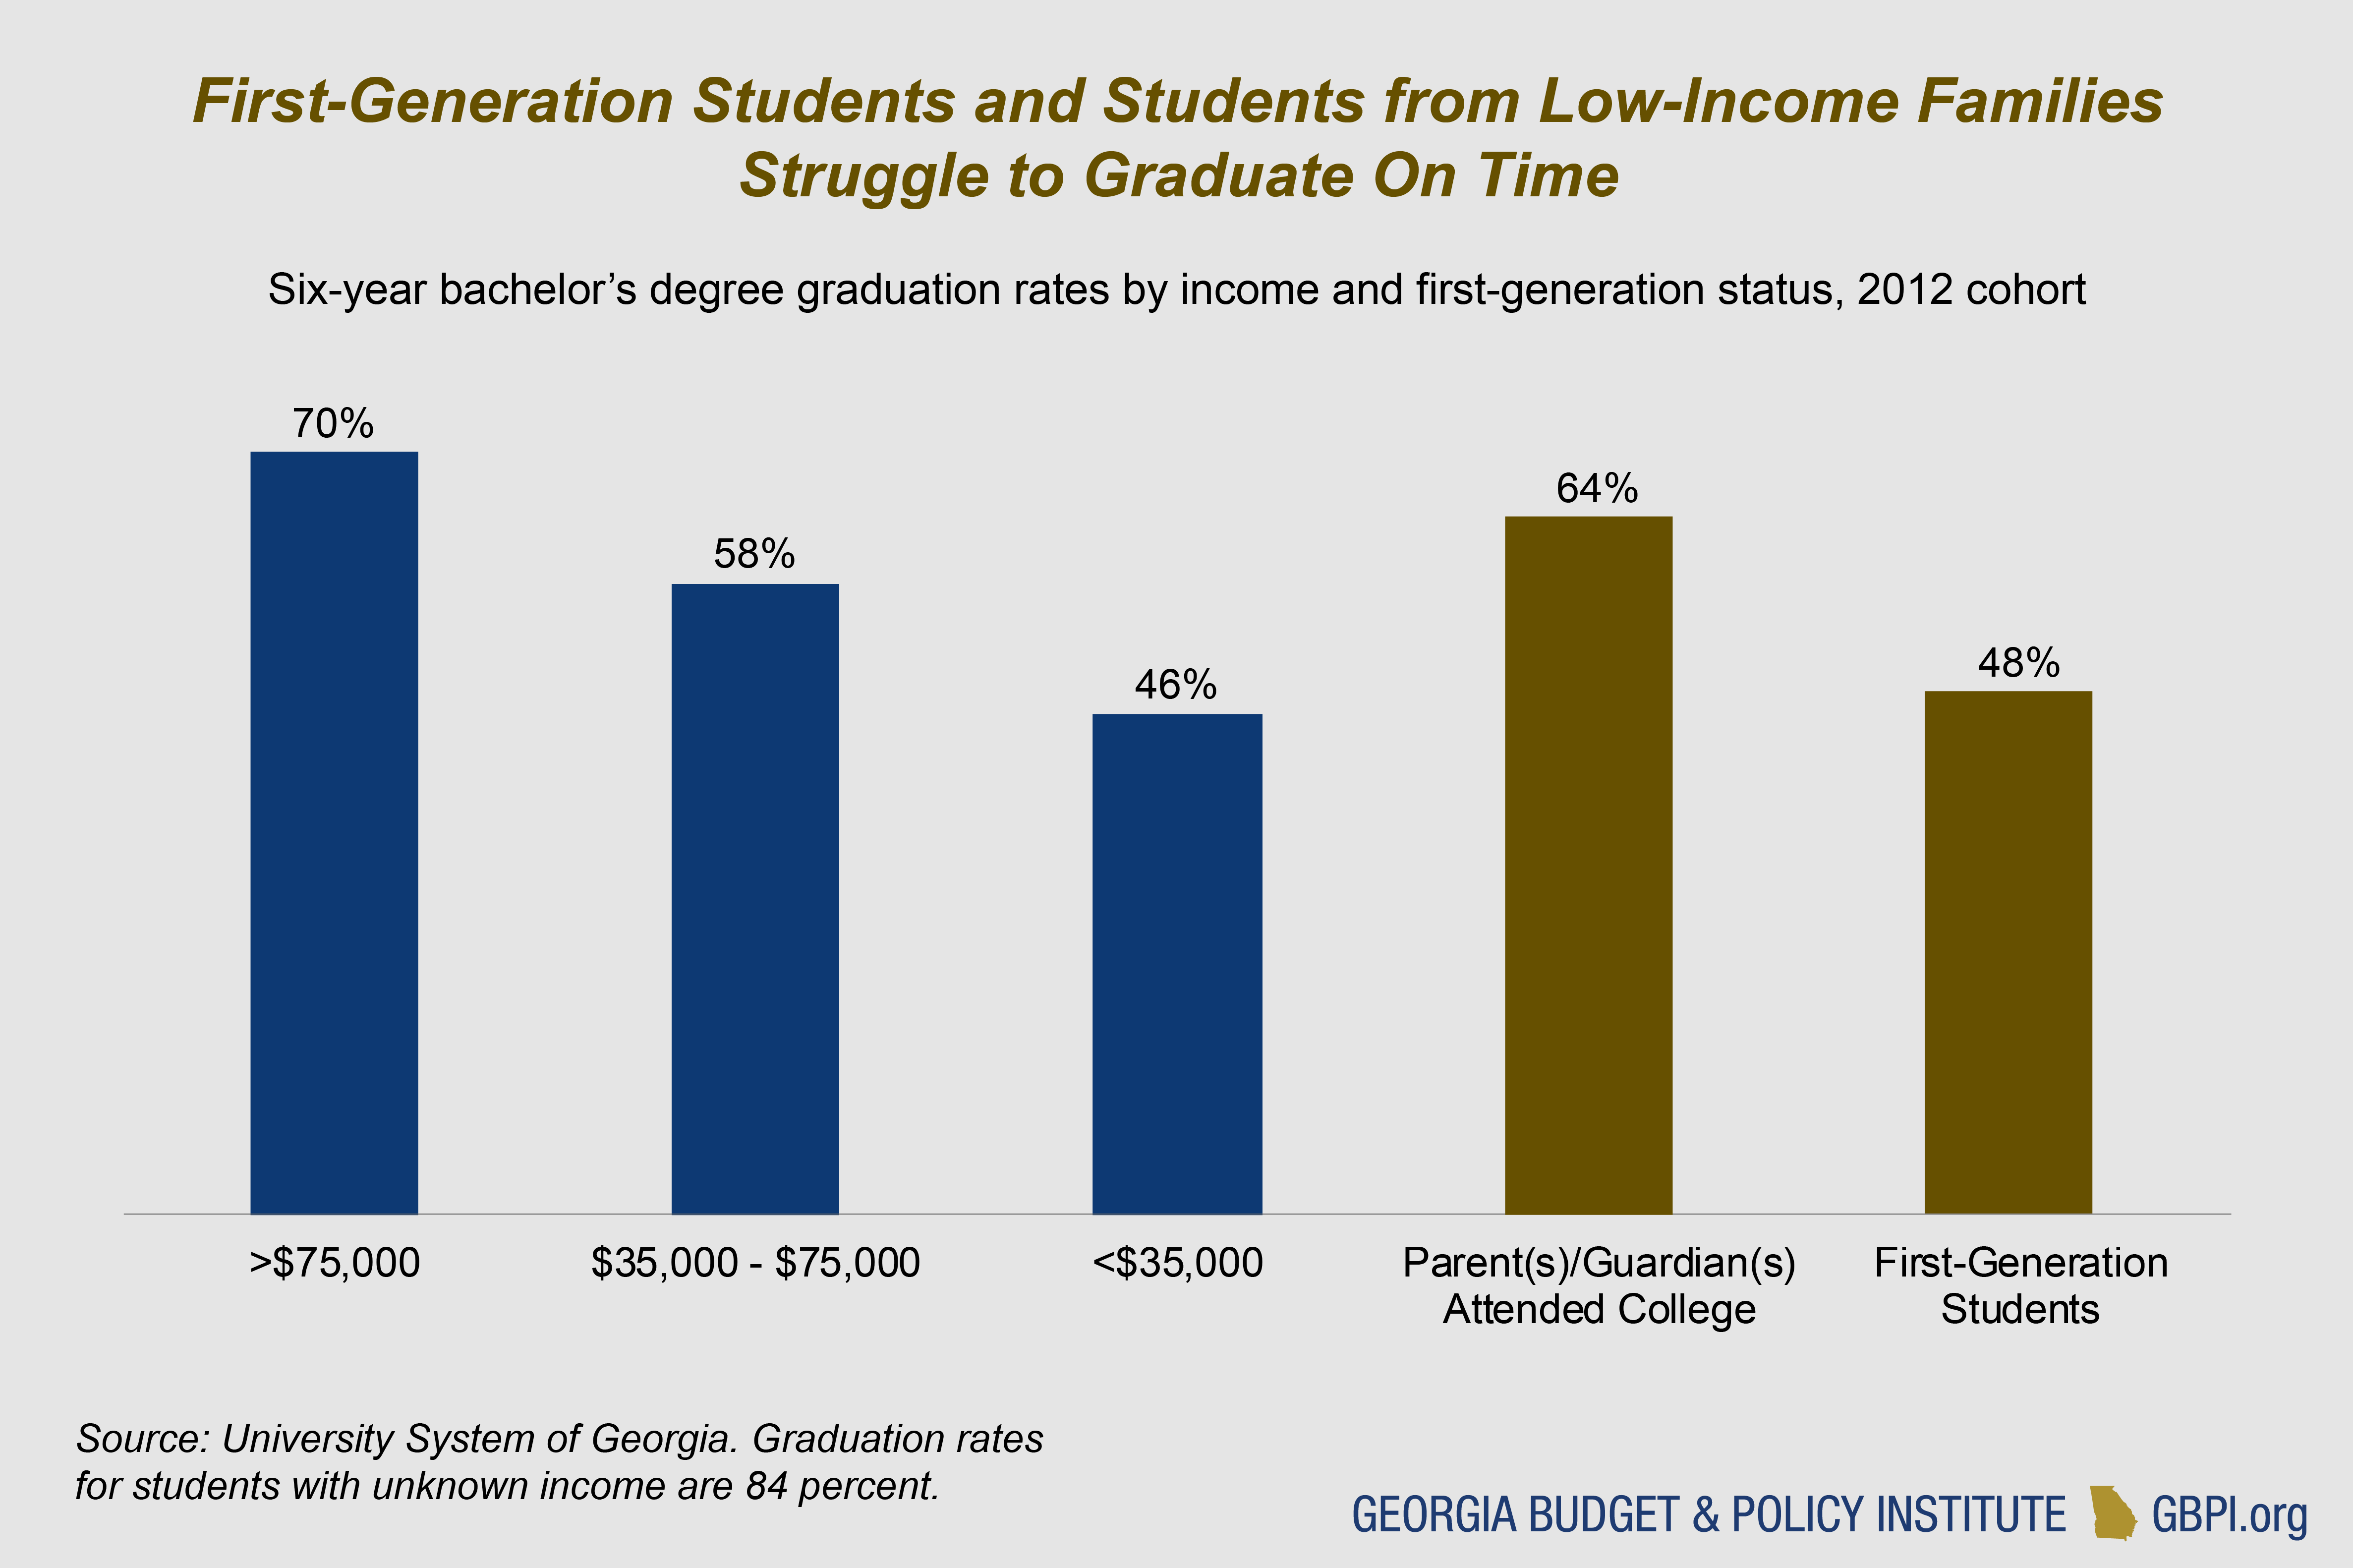 The relative share of first-generation students, students from lower-income families and part-time students affect overall graduation rates for a school. For example, graduation rates are highest for students in research universities, which also tend to be the most selective and serve smaller shares of part-time students, first-generation students and students from low-income families compared to comprehensive universities, state universities and state colleges. Research universities also receive more funding than other institutions.
Graduation rates also differ by race and ethnicity. Though individual colleges have successfully removed barriers to graduation for black and Latino students and raised overall graduation levels, the university system as a whole has yet to reach this goal. Black students enroll in college in high numbers, but less than half of first-time, full-time freshmen will graduate with a bachelor’s degree within six years, compared to 66 percent of white students.[27]
Though black students do not all experience college the same way, many face a combination of challenges that create barriers to graduation. Black students are more likely than students of other races and ethnicities to attend colleges with fewer resources.[28] Historical wealth and income inequalities mean financial strain during college is particularly acute. One out of every 10 black college students experiences homelessness, and almost half worry their food will run out before they can buy more.[29] A lack of encouraging and welcoming interactions with faculty, staff and other students can also affect a sense of belonging and commitment critical to persistence and graduation.
Georgia can keep up with the need for more college graduates only by transforming policies and practices to remove barriers for black, Latino and first-generation students, and students from families of modest means. More students are getting into college, and the trend is expected to continue as the economy demands more postsecondary credentials. The state should strive for the same high graduation rates among all student groups.
Technical College System of Georgia: Job Training and Access to Higher Education
The technical college system provides technical education, as well as adult education services to Georgians without a high school diploma and custom workforce training for employers. It includes 22 technical colleges with campuses throughout the state.
Total Georgia technical college enrollment reached 137,208 in 2018. Sixty-two percent of technical college students are women.[30] Seventy-one percent attend part-time.[31] Though most technical colleges serve both rural and urban areas, one-third of Georgia’s technical colleges serve predominately rural areas.[32]
Nearly half of technical college students receive the federal Pell Grant.[33] Though not all low-income students apply or are eligible for the Pell Grant, 68 percent of recipients are from families with less than $30,000 income a year.[34] Thus, these data can be used as a proxy for how many students in the technical college system come from low-income families. Based on available data, median wages for technical college students five years after graduation range from about $25,000 to $40,000 for certificates and $27,000 to $44,000 for associate degrees.[35]
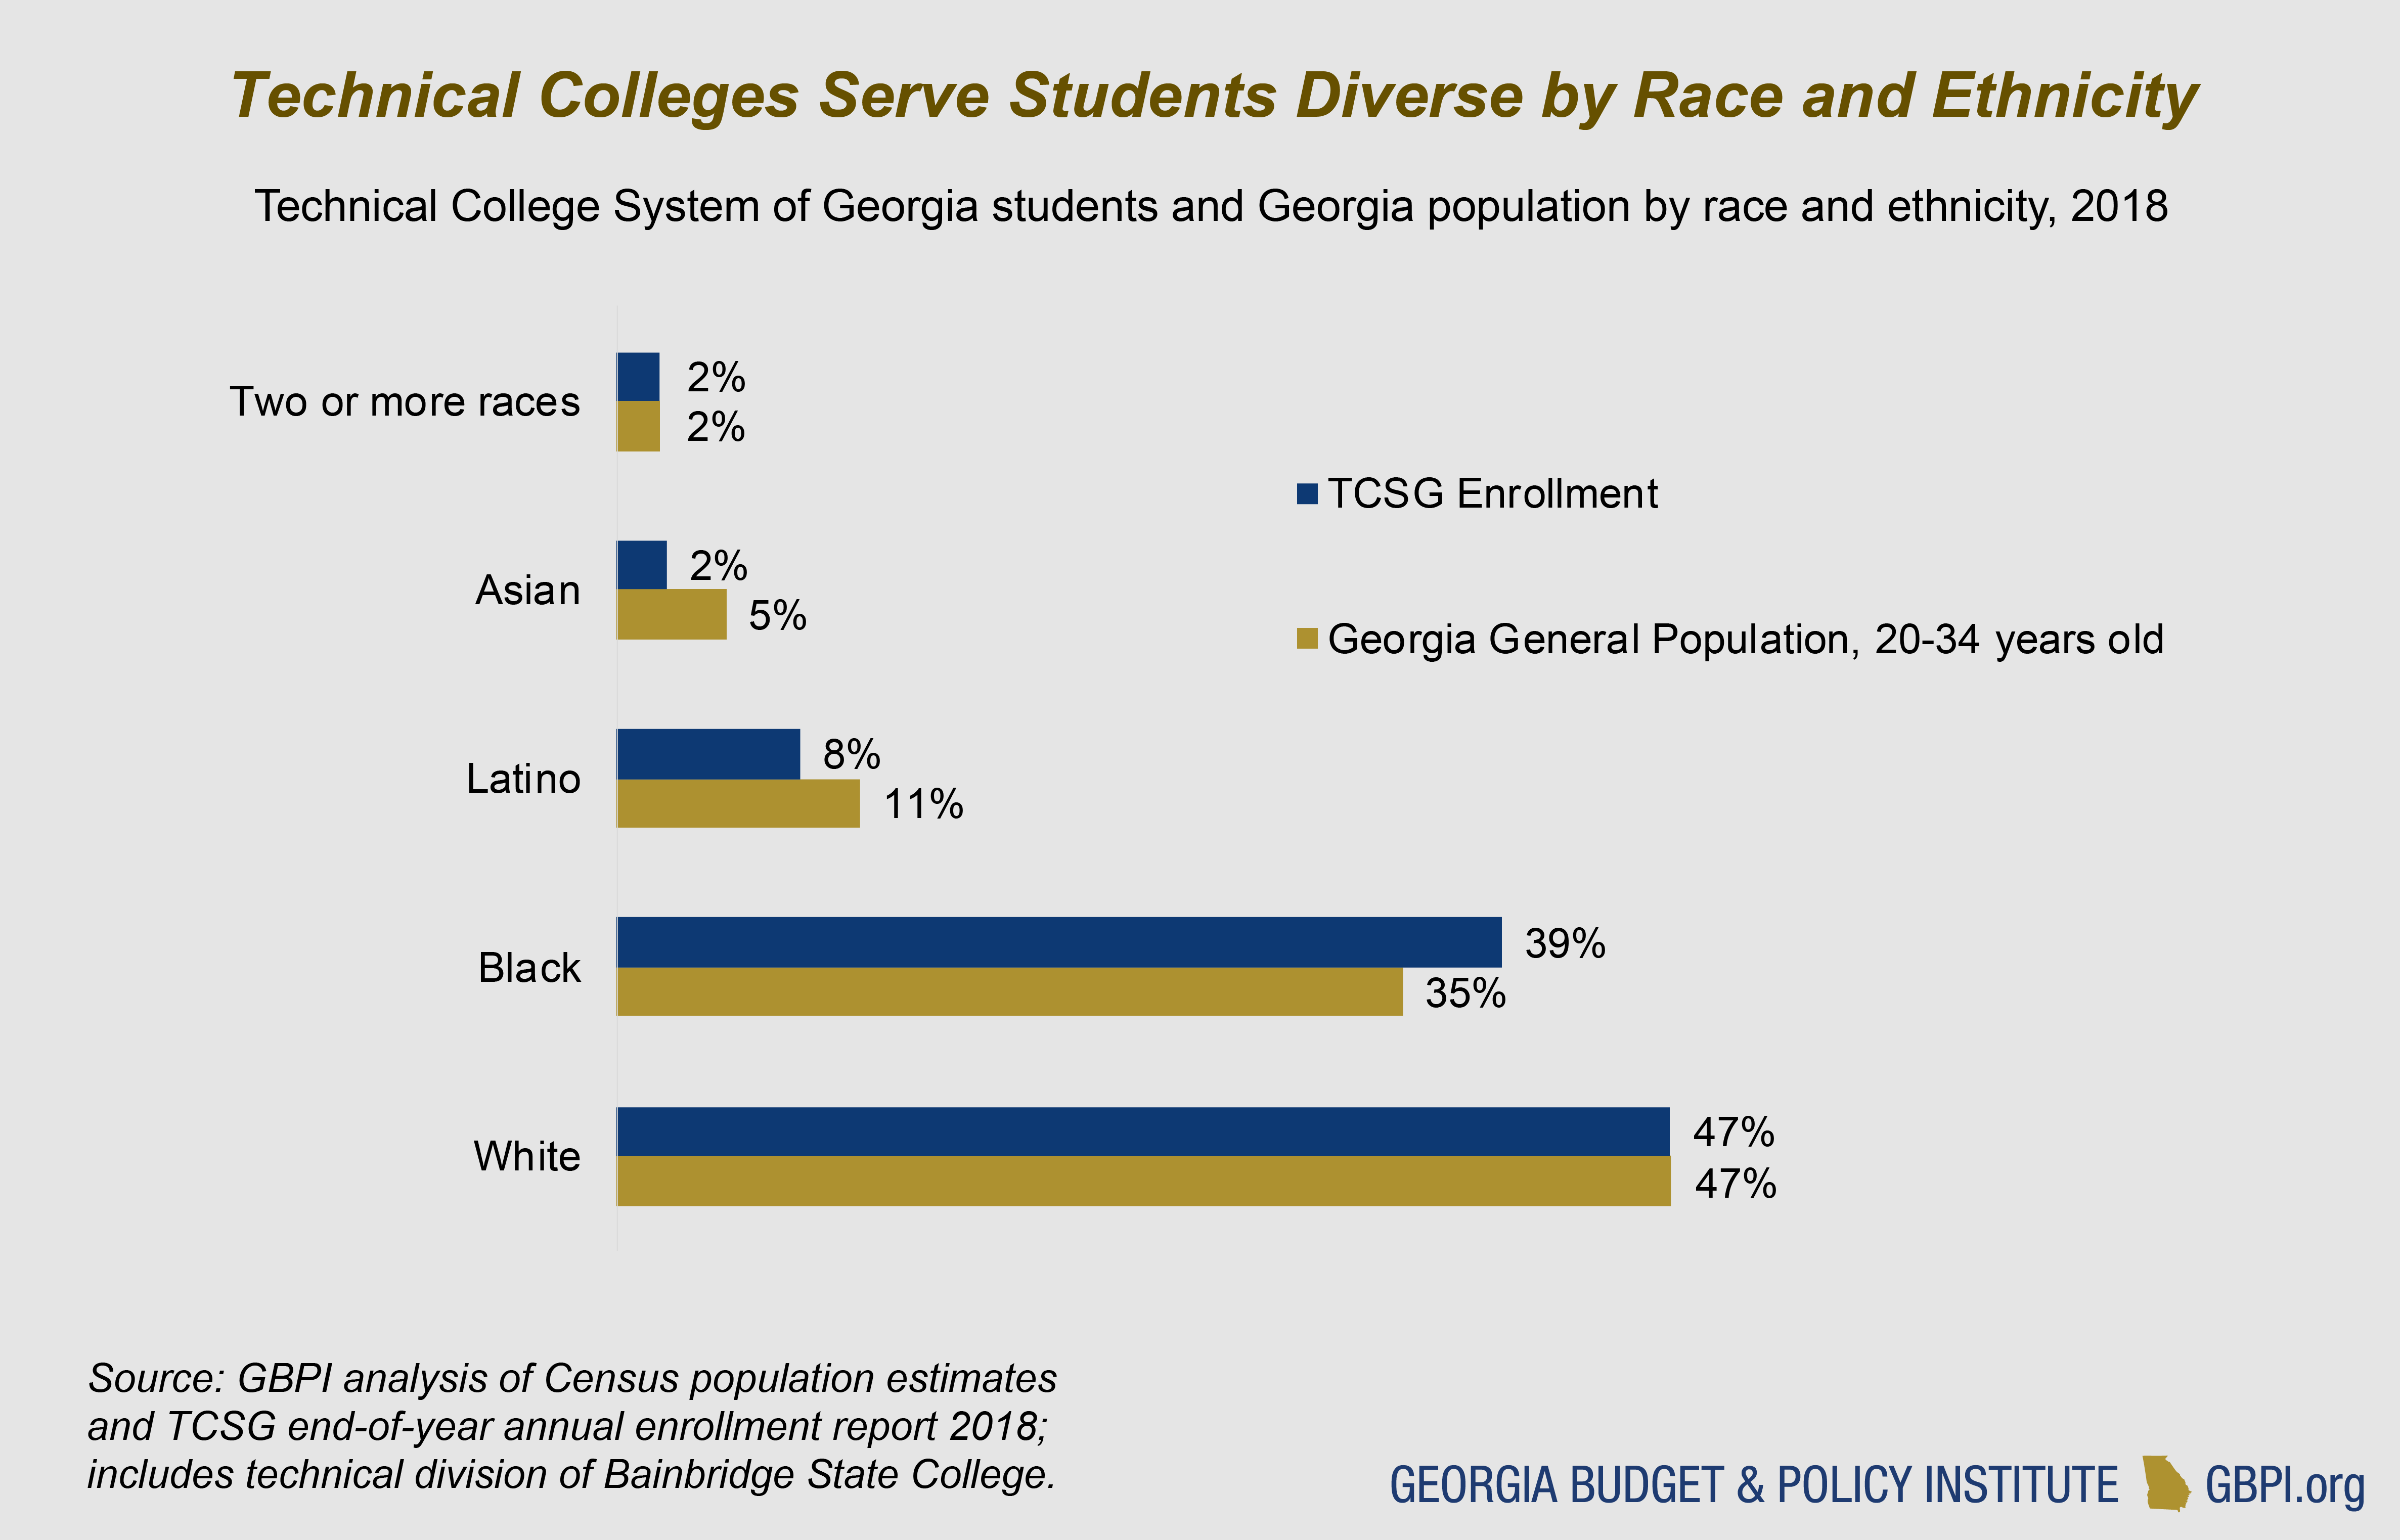
Technical college students come from diverse ethnic and racial backgrounds. Forty-seven percent of students are white, and 39 percent are black. Technical college students nearly reflect the racial-ethnic composition of Georgia’ young adult population, with black students somewhat overrepresented.[36]
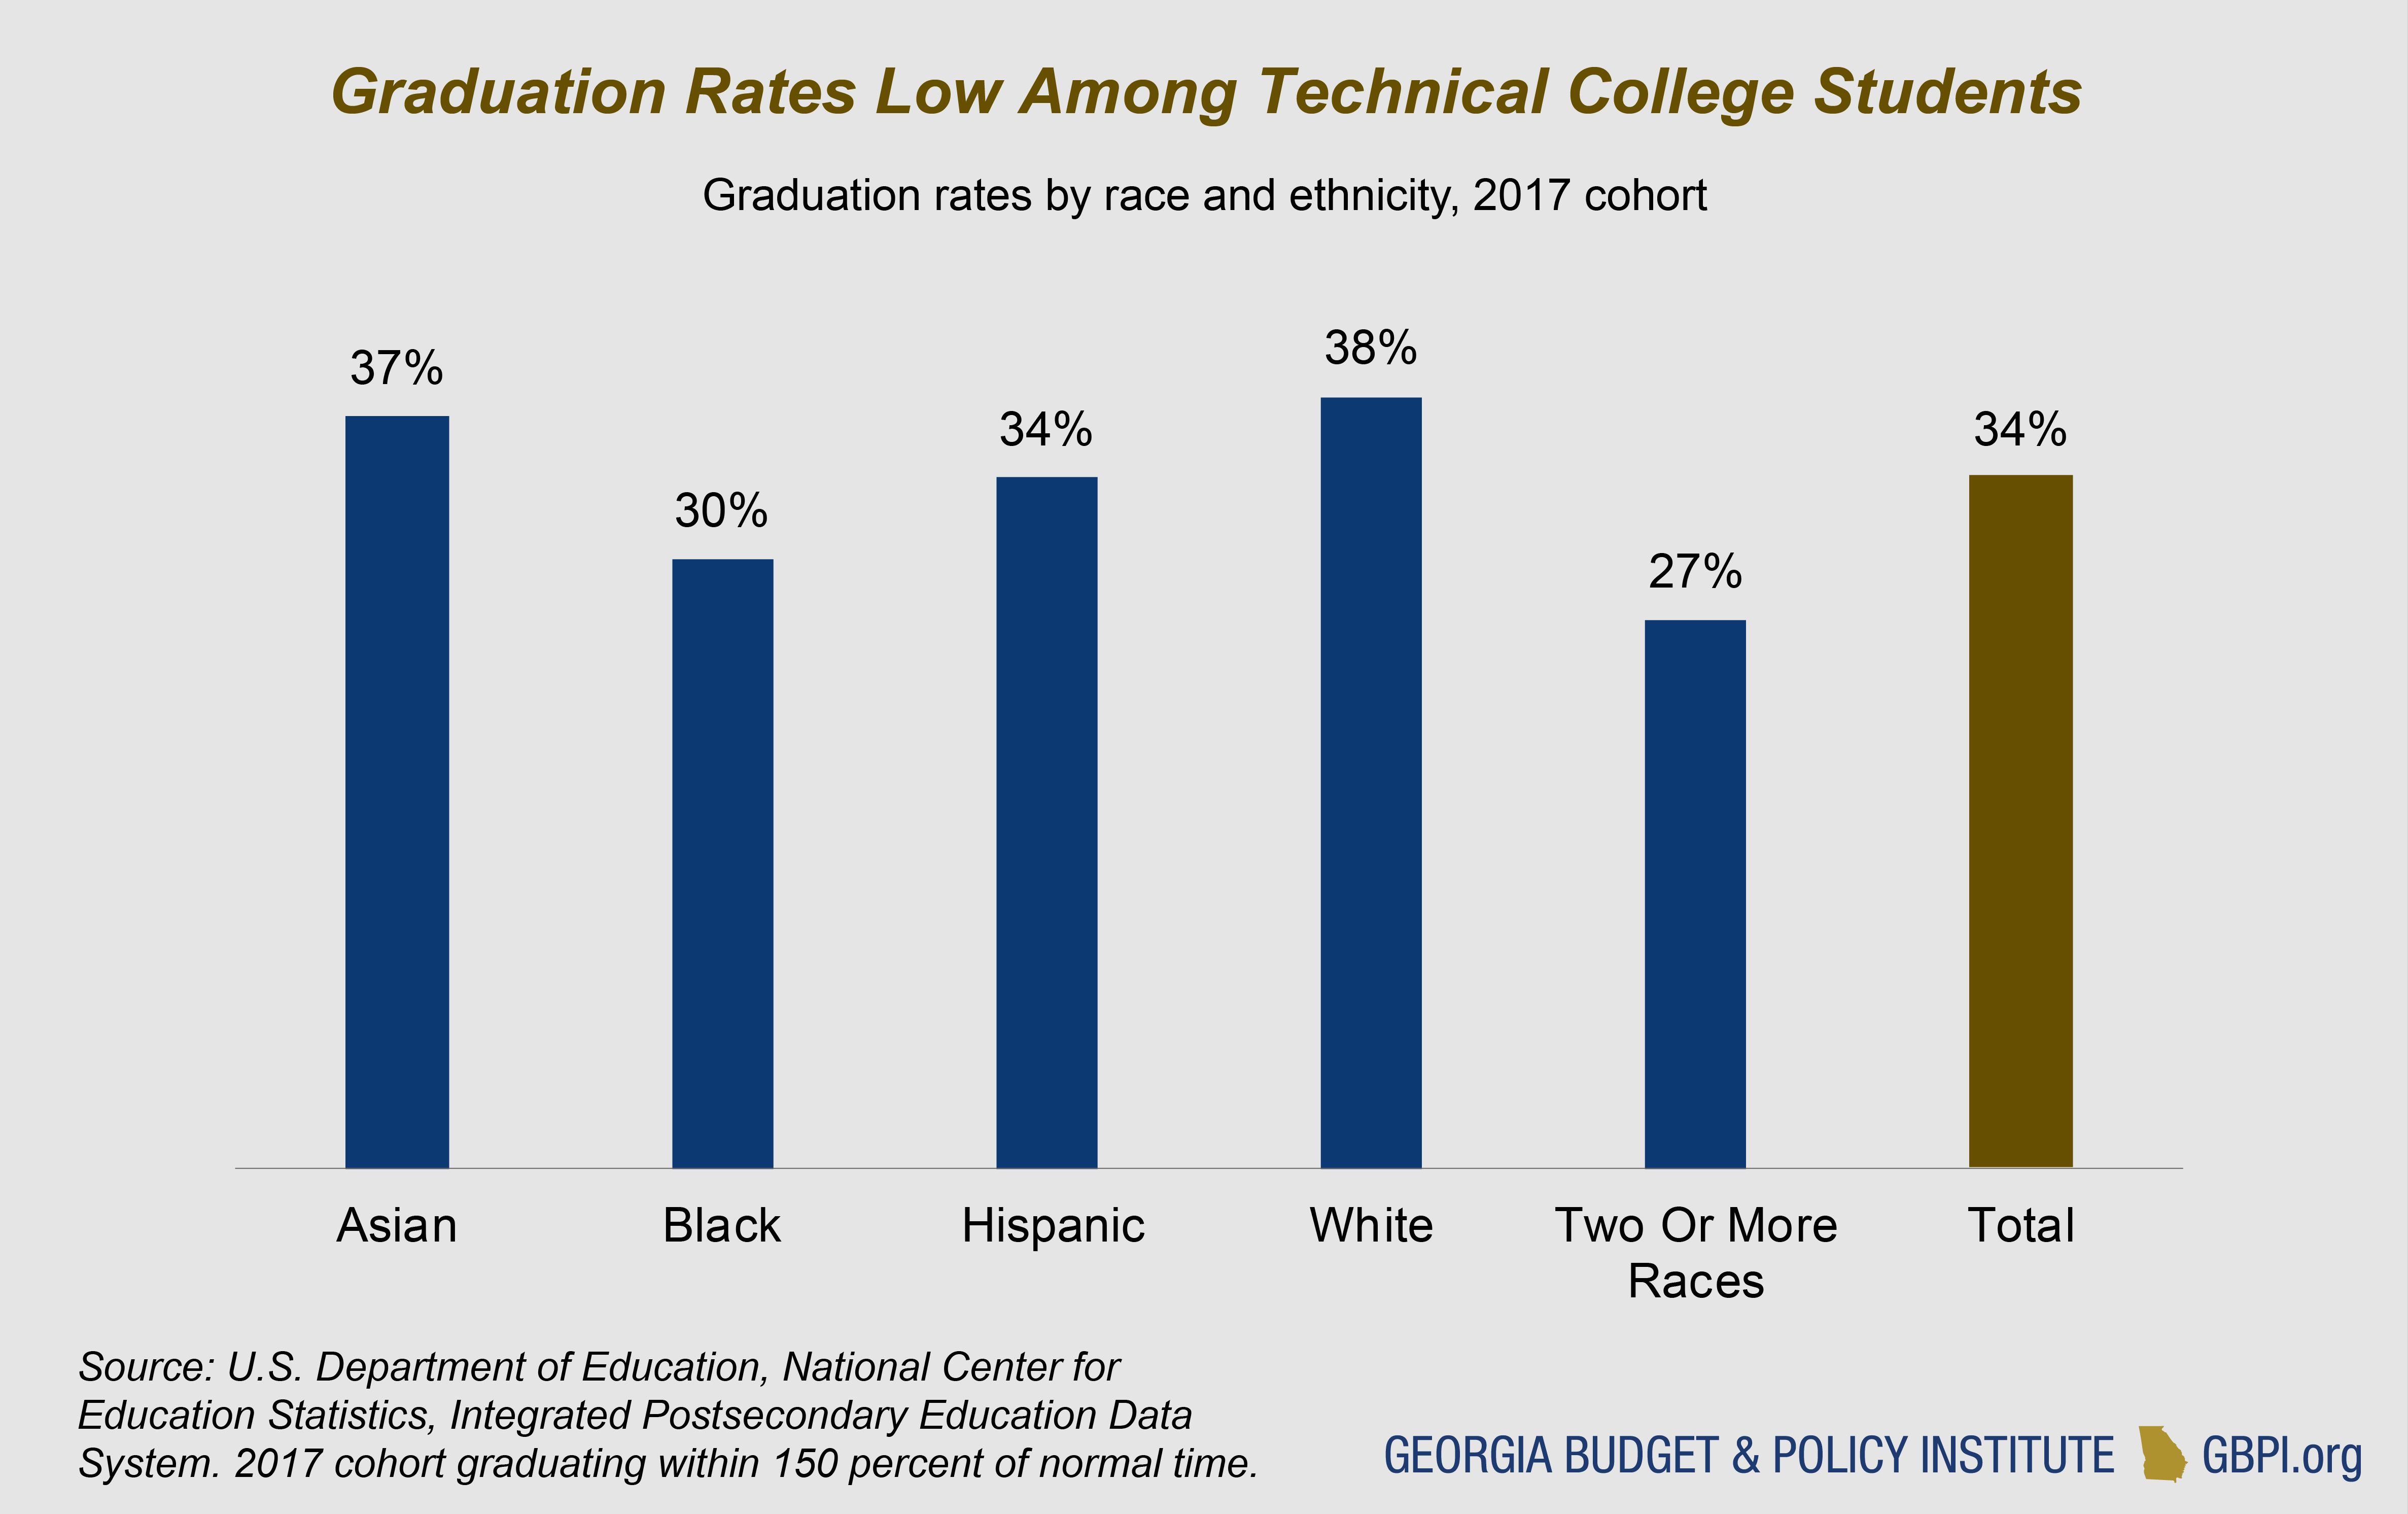
 One in three students who starts a technical certificate, diploma or degree will finish a credential at a technical college within 150 percent of the normal time for completion (e.g. within three years for an associate degree). Some technical college students choose to work full-time or transfer to a university system school before finishing their credential. Each year, more than 4,000 students with technical college credits transfer to a university system school.[37]
 Technical College Students Getting Younger, Enrolling in Longer Programs
Technical education enrollment responds to economic cycles. When unemployment goes up, displaced workers who want to upgrade their skills often enroll in technical colleges. The improving economy has led to drops in technical college enrollment, but the growth of Dual Enrollment, a state program where high school students can take college courses for free, has added to enrollment. These two forces, the improving economy and the growth of Dual Enrollment, have changed the historical makeup of technical colleges.
Technical colleges offer three award types: technical certificates of credit, diplomas and associate degrees. For the first time, associate degree enrollment is now higher than both technical certificate and diploma enrollment. In general, certificates take the shortest time to complete, and associate degrees take the longest. Certificate and diploma enrollment shot up during the recent recession and dropped after 2011. Associate degree enrollment continued steady increases and is now higher than certificate and diploma enrollment.[38]
Technical college students are diverse in age. Forty-three percent are younger than 21; 22 percent are 21 to 25; and 36 percent are older than 25. But for the first time, students under 21 outnumber those over 25. The recession dramatically increased the number of students older than 25, but enrollment in this age group decreases as job opportunities improve for older workers. Enrollment of students under age 21 grew the past few years, bolstered by high school students in Dual Enrollment.[39] Many of those students use Dual Enrollment to take general education classes such as English and math.
The public university and technical college systems work together to educate Georgians who seek postsecondary credentials. Many Georgians will attend schools in both systems during their lifetimes. Providing public funding and support for these two educational systems is a critical part of the state budget and its responsibility toward its people.


State Funding, HOPE and Affordability
State Funding for Higher Education
Georgians contribute billions of dollars to higher education each year. Revenues from personal and corporate income taxes and the state sales tax, known as state general funds, go to support Georgia’s public college and universities. State lottery funds go to HOPE scholarships, grants and low-interest loans. Students and their families also pay tuition and fees to colleges and universities.
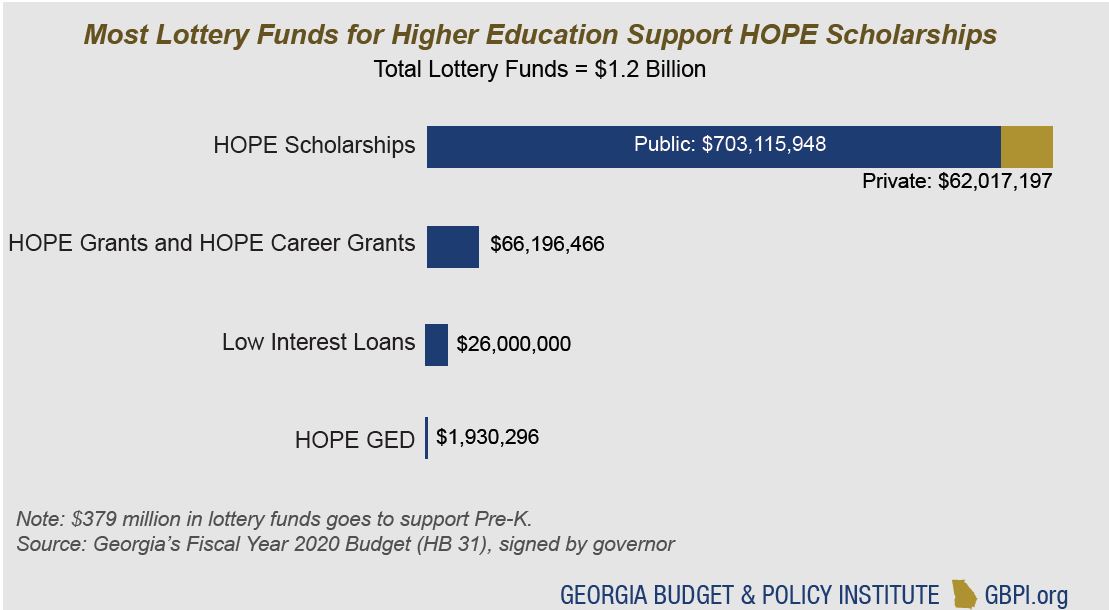
The state’s 2020 budget allots about $3.9 billion to support higher education including state and lottery funds. Lottery proceeds are more than one-fifth of total higher education spending. Higher education spending in the state’s 2020 budget includes:
- $2.6 billion in state funds for the University System of Georgia[40]
- $334 million in state funds for the Technical College System of Georgia[41]
- $860 million in lottery funds for college scholarships and loans, administered by the Georgia Student Finance Commission
- $101 million in state funds for Dual Enrollment, administered by the Georgia Student Finance Commission
The state also budgeted $209 million from the state general fund to finance bonds for new construction, equipment or renovations in the university system and $106 million for the technical college system.[42]
The state Legislature appropriates money in a lump sum to the university and technical college systems each year. The systems then allocate funds to individual schools.
State appropriations pay for much of the cost of providing higher education in Georgia. But long-term trends show per-student funding in decline, with large drops during economic recessions.[43]
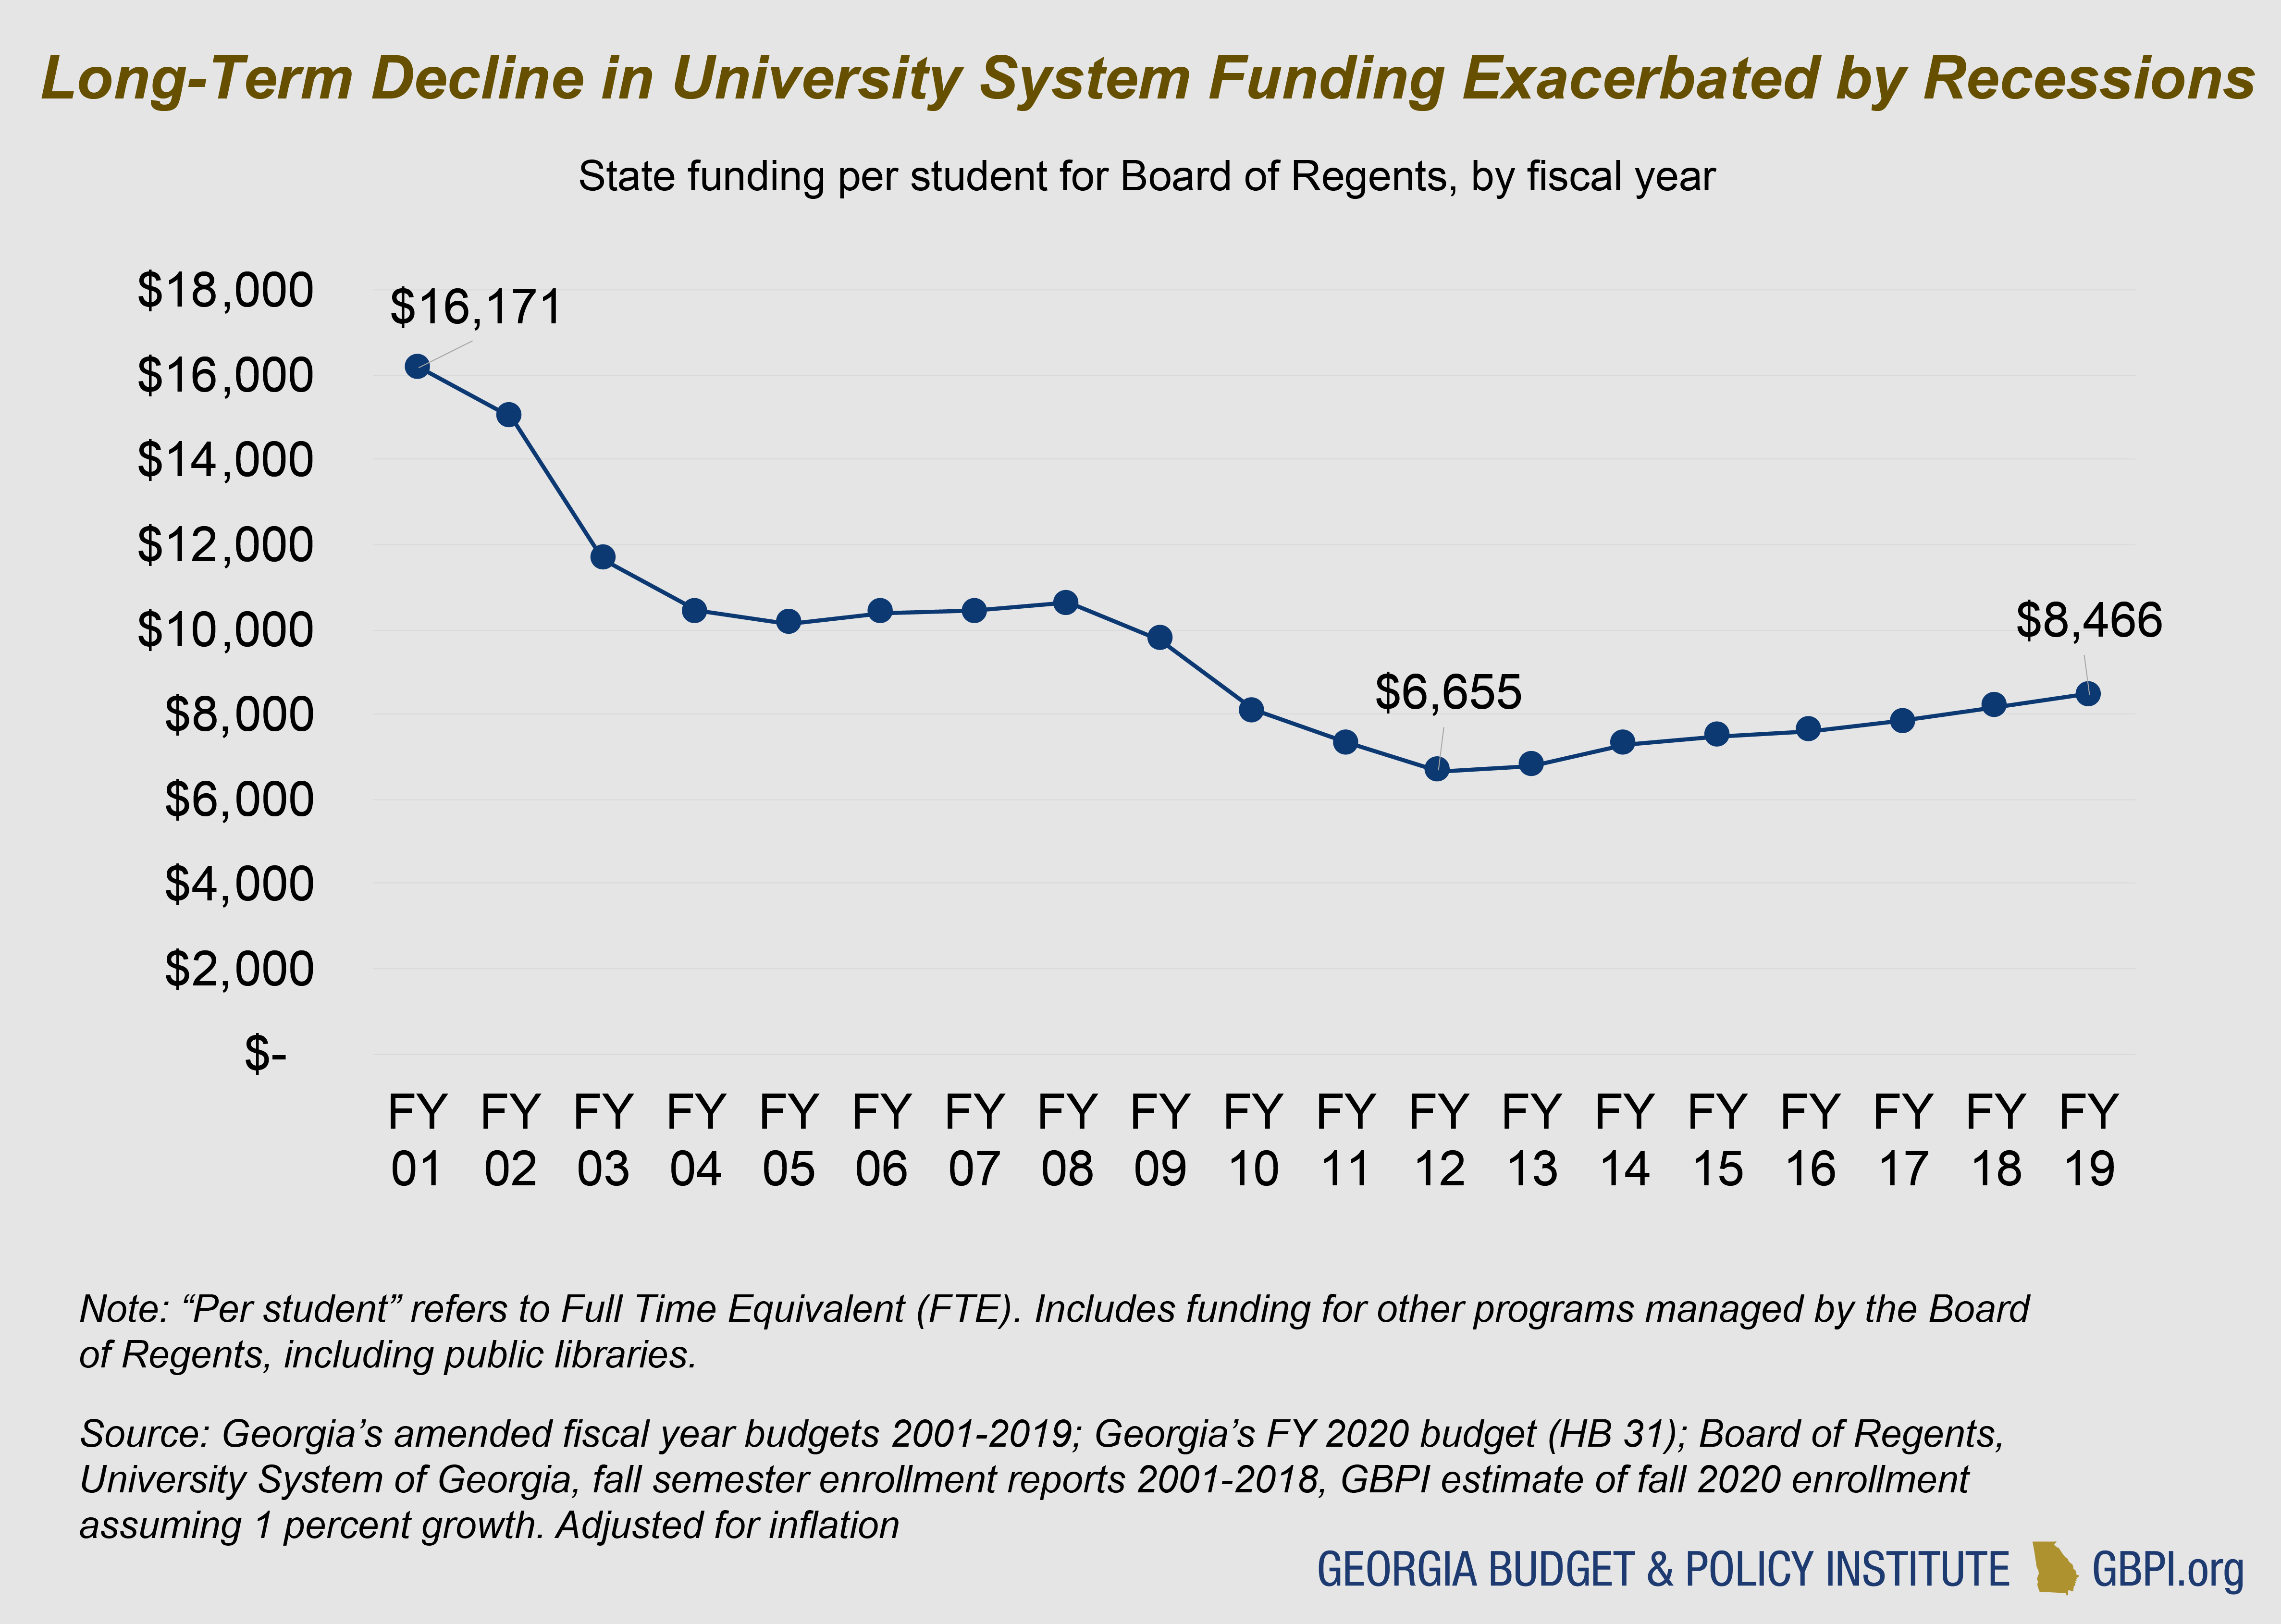 Technical college funding at the student level is even more vulnerable to economic decline. During the last recession, state lawmakers cut budgets even as displaced workers trying to upgrade their skills caused enrollment to surge. Per-student funding was cut in half in two years. As the economy improves, technical college enrollments decrease, and per-student funding nears pre-recession levels.[44]
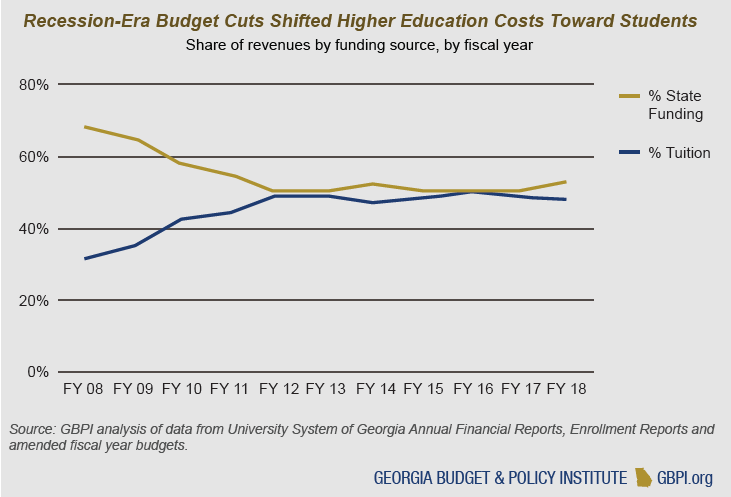
 Budget cuts shifted the cost of higher education onto students and families. As state support declined, colleges cut services and raised tuition and fees. In 2008, before the recession, money from state support and tuition totaled about $16,000 per student, adjusting for inflation. After years of budget cuts, combined state and tuition dollars recovered to that amount in 2018. Students now shoulder about half the cost of public higher education, compared to a third before the recession.
 State Financial Aid
Georgia appropriates money from lottery proceeds for HOPE scholarships and grants each year. Student eligibility for these state financial aid programs depends on multiple factors: a student’s grade point average, standardized test and rigorous course requirements, time after high school, legal residency, prior felony and prior student loan default.
The major HOPE programs are:
HOPE Scholarship – Partial tuition for bachelor’s or associate degrees at public and private colleges and universities
Zell Miller Scholarship – Full tuition for bachelor’s or associate degrees at public colleges and universities, partial tuition at private colleges
HOPE Grant – Partial tuition for certificates or diplomas in technical colleges
Zell Miller Grant – Full tuition for certificates or diplomas in technical colleges
HOPE Career Grant – Partial tuition for specific certificates or diplomas
Student Access Loans – 1 percent interest loans for students who maxed out on all other loans and aid
HOPE Scholarships
HOPE Scholarships are the state’s largest and most well-known financial aid program. Forty-four percent of bachelor’s degree students and 22 percent of associate degree students in the university system receive the HOPE or Zell Miller Scholarship. HOPE Scholarship receipt varies by school. The school with the highest share of HOPE Scholars is the University of Georgia, where 81 percent of in-state students get the HOPE or Zell Miller Scholarship.[45] HOPE Scholarships for University of Georgia students totaled about $176 million in lottery funds in 2018.[46]
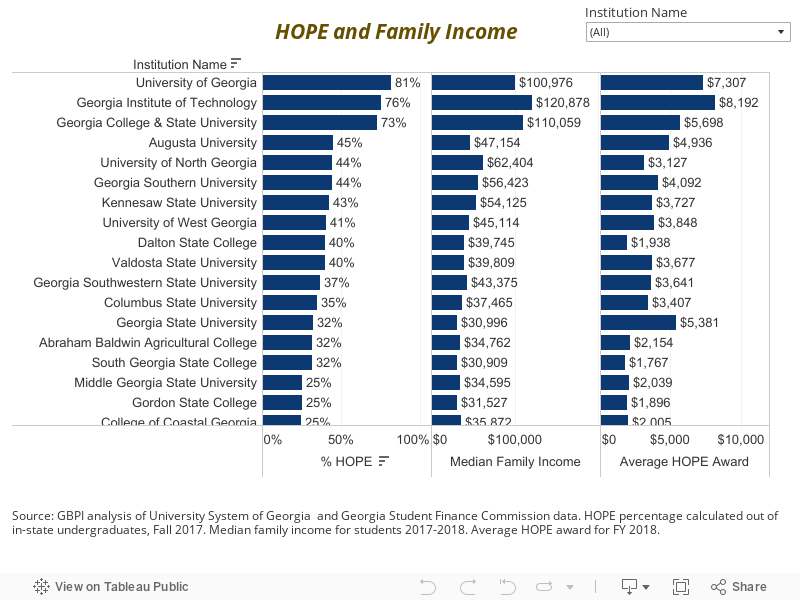
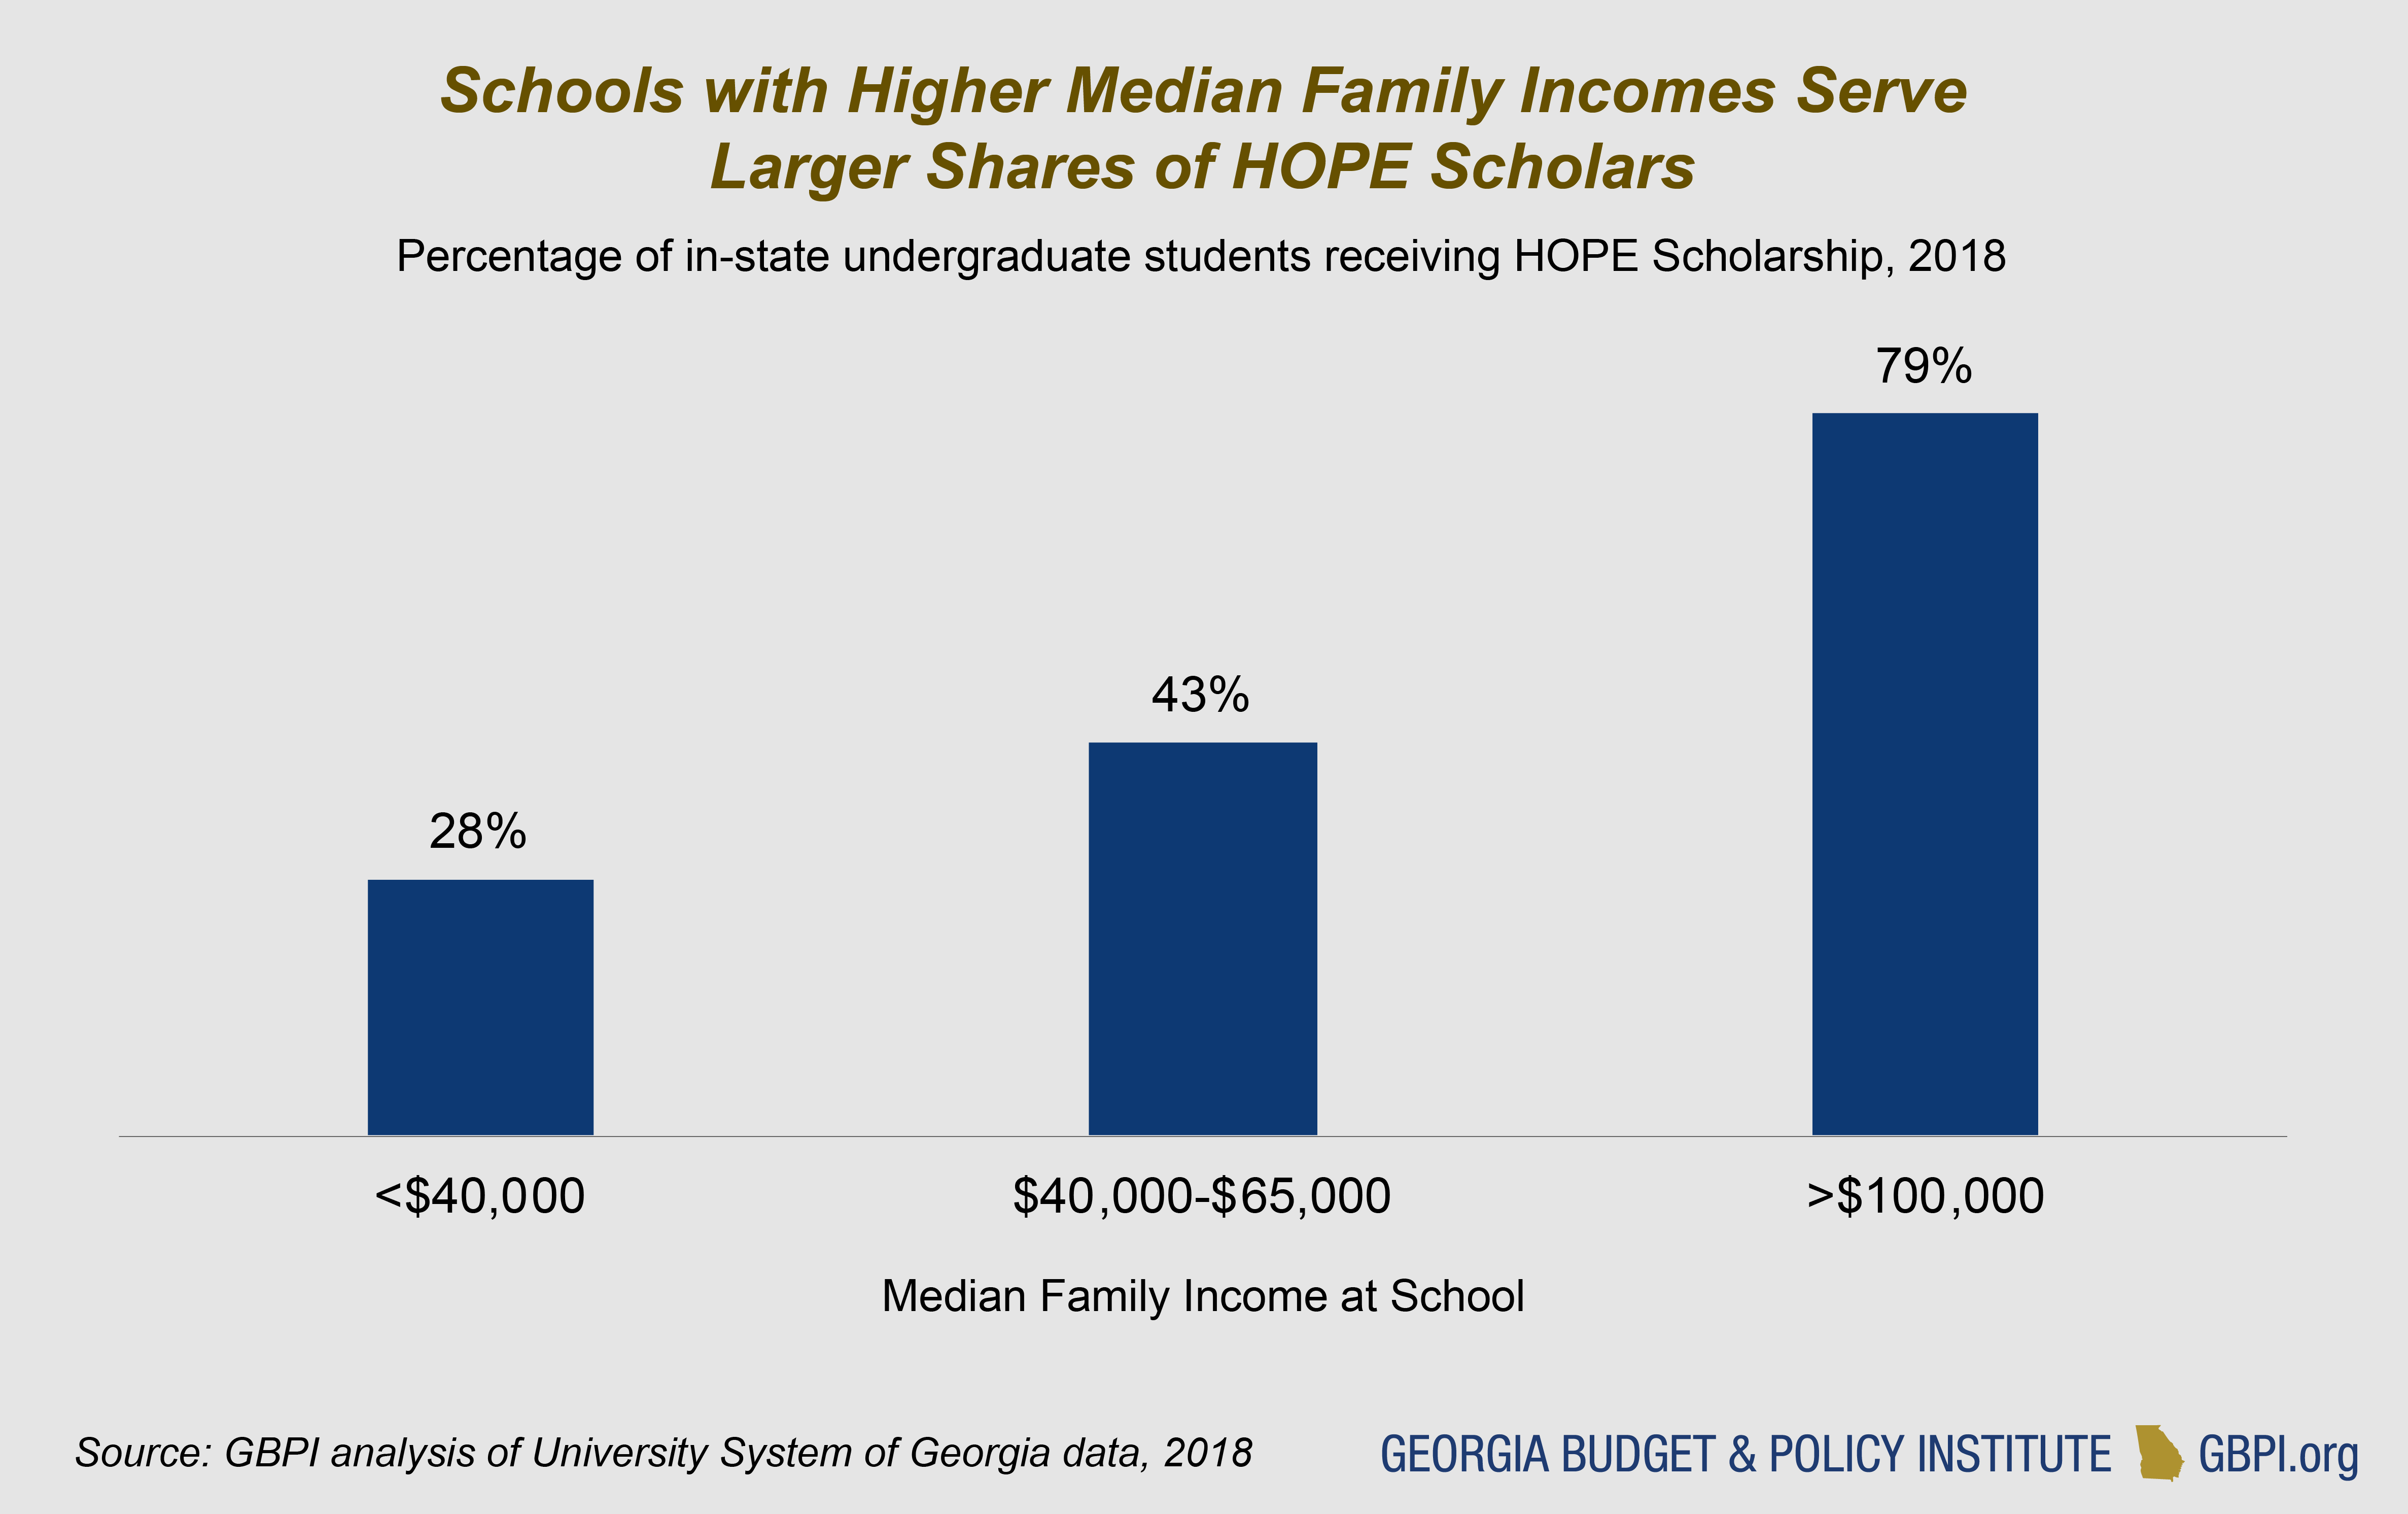
The higher the median family income of students is at a school, the larger the share of HOPE scholars. Black students are underrepresented among HOPE scholars, with about 30 percent of total undergraduates and only 17 percent of HOPE scholars.[47]
 HOPE Grants and HOPE Career Grants
HOPE Grants cover 73 percent of certificate and diploma students in technical colleges. Twenty-seven percent of certificate/diploma students, or about 15,000 students, receive the HOPE Career Grant on top of their HOPE or Zell Miller Grant.
Women receive 55 percent of HOPE Career Grants and make up 62 percent of total technical college students. HOPE Career Grant recipients closely reflect the racial-ethnic distribution of total technical college students.[48]
Dual Enrollment
Dual Enrollment allows students to enroll in college courses while in high school. Students and their families do not pay for tuition, fees or books. Georgia supports Dual Enrollment through funding to the Georgia Student Finance Commission for tuition payments and by including Dual Enrollment students in enrollment-based funding formulas for public high schools and colleges.
The 2020 state budget allocated $101 million for Dual Enrollment, up from $49 million in 2016. Lawmakers did cut Dual Enrollment funding from 2019 to 2020, even as more students enroll in these college courses. In Fall 2018, about 12,000 high school students enrolled in University System of Georgia courses; 25,000 enrolled in Technical College System of Georgia courses, and 5,000 students enrolled in private colleges.[49]
College Affordability
The HOPE programs serve as the state’s main financial aid support. Funded at $860 million in lottery funds, HOPE is the most generous state financial aid program in the country. Yet Georgia is one of only two states that do not offer broad need-based scholarships to students.
 Georgia students depend on federal sources for need-based aid. In 2016-2017, Georgia students qualified for $825 million in need-based federal Pell Grants, with $658 million used at public colleges. The average Pell Grant for Georgia students attending public colleges was $3,451 for the academic year.[50]
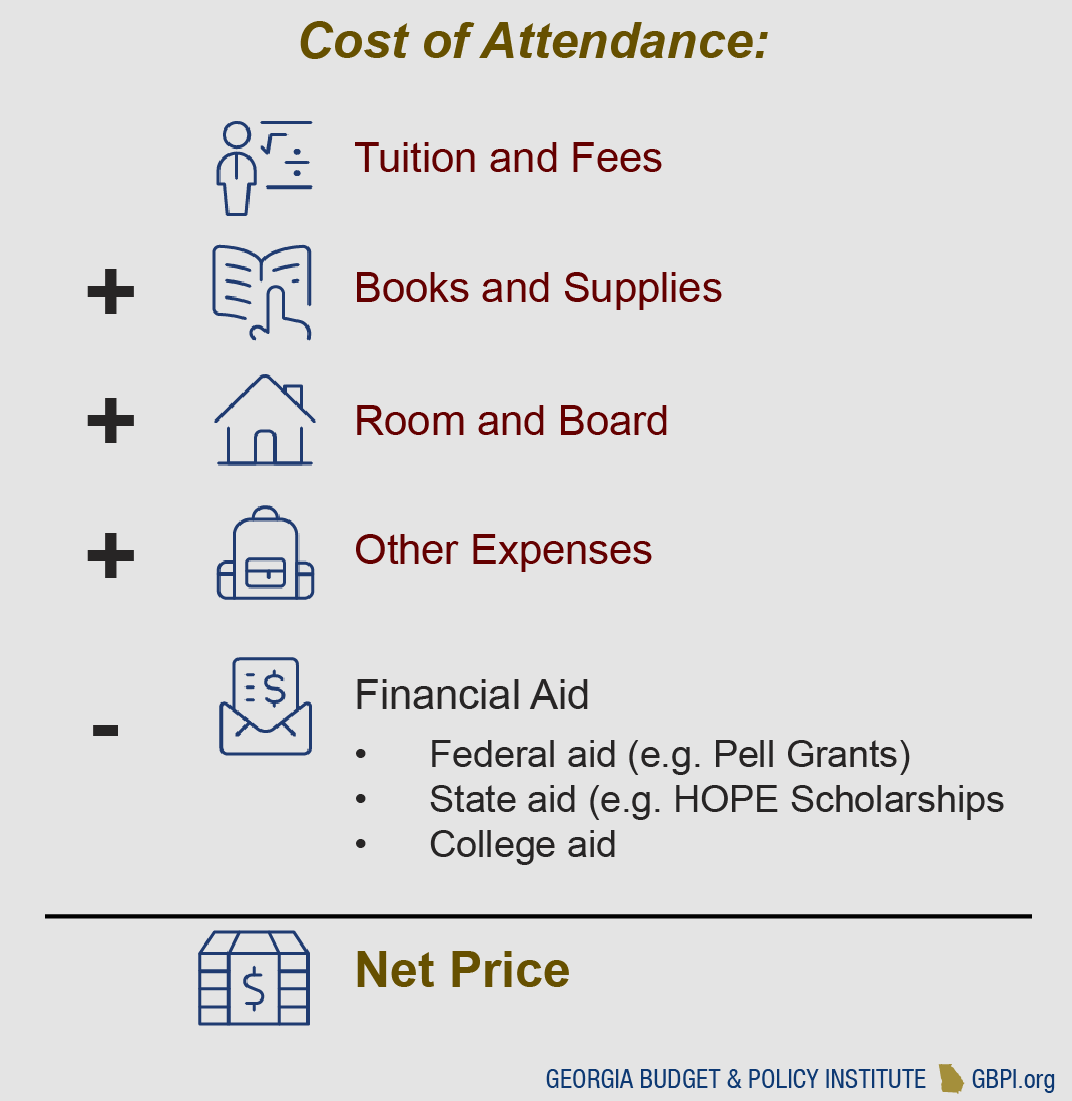
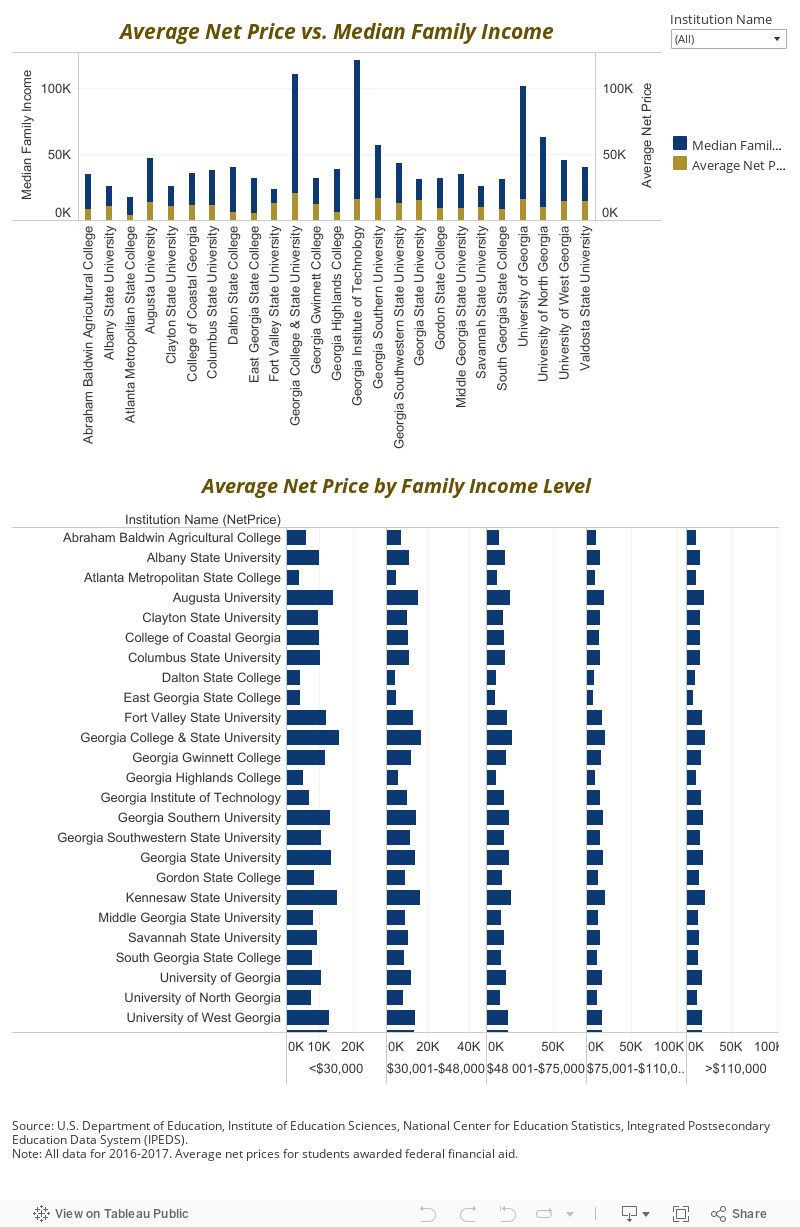
Even with federal and state financial aid, many students must pay a large portion of the cost of college. Net college prices for full-time undergraduate students who receive financial aid and pay in-state tuition rates varies from $5,768 to $20,000 per year in the university system. At technical colleges, though most students do not live on campus, net prices are estimated at between $626 and $5,481 per year.[51]
The same net price can translate into different financial burdens for students and their families because of income differences. For example, the average net price of two Atlanta schools, the Georgia Institute of Technology and Georgia State University (GSU), are both around $15,500. But the median family income of students attending Georgia Tech is far higher at $121,000, compared to $31,000 for GSU students. The same net price represents 50 percent of the typical family income at GSU, versus 13 percent of typical family income at Georgia Tech.[52]
Because public colleges and universities get state funding that is generated by taxes, most Georgians pay in-state tuition rates. In the university system, out-of-state tuition rates are three times higher. In technical colleges, tuition rates are four times higher. Unauthorized immigrants, including those who participate in Deferred Action for Childhood Arrivals (DACA), pay out-of-state rates. DACA participants are lawfully present in the U.S., but do not currently have a path to permanent legal status. State policy also allows schools to grant tuition waivers that allow non-resident students to pay in-state tuition for many reasons, including excellence in academics or athletics. Some students in neighboring states receive these tuition waivers.
Finally, as the state invested less per student and tuition and fees rose, the wages most students earn fell behind. Today, the state invests about half of what it did per student than it did 20 years ago, after adjusting for inflation.[53] In 2001, a student could work a full-time, minimum-wage job over the summer and earn enough to pay for two semesters of tuition and fees at Kennesaw State University. Today, wages from a full-time, minimum-wage summer job would cover one semester of tuition only at Kennesaw.[54]
Student Debt
When students cannot pay up front for college expenses, some students turn to federal loans. During an academic year, about half of university system students turned to loans.[55] Borrowing can be a rational choice for students to finance an education they hope will lead to better job prospects and financial opportunities. Nevertheless, for some students, especially those who do not graduate or those who face a poor job market, student debt can be a serious financial burden and risk to their financial futures.
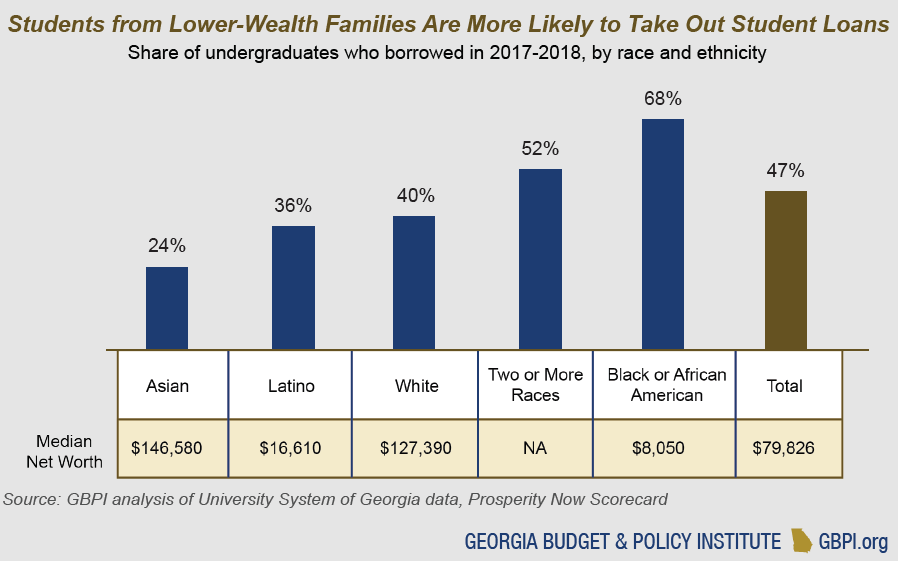
The likelihood that a student will turn to loans varies by family wealth and assets, which corresponds to race and ethnicity. Black students have the highest borrowing rates, and their families have the lowest net worth. Asian students have the lowest borrowing rates, and their families have the highest net worth. National estimates show that Asian household wealth is more than 18 times that of black household wealth.[56]
 Average loan amounts vary more by school than by race and ethnicity. For example, at both Abraham Baldwin Agricultural College (ABAC) and Georgia College and State University, about 43 percent of students will take out a loan. But the average student-borrower at ABAC, a lower-tuition state college, will borrow about $5,700 in one year, compared to $9,300 borrowed by students at Georgia College and State University, a higher tuition school.
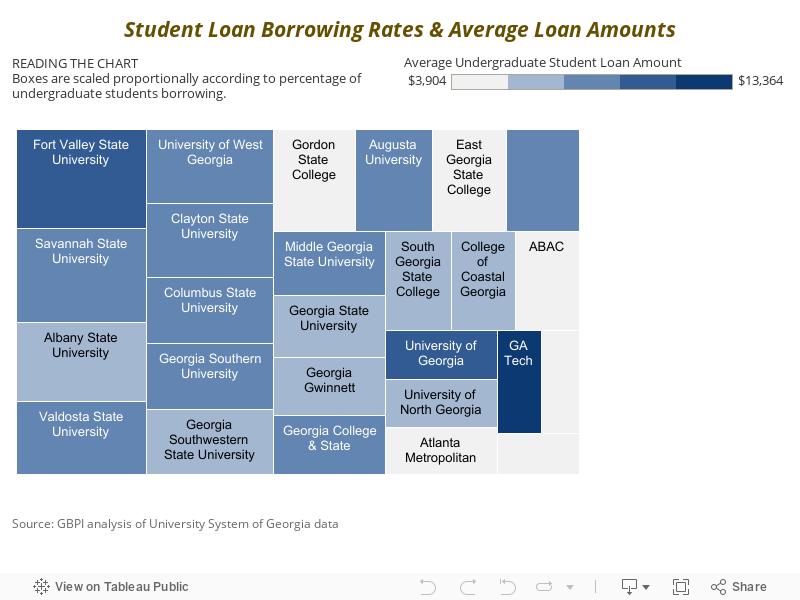
Schools with higher-than-average loan amounts but lower-than-average borrowing rates include the Georgia Institute of Technology, the University of Georgia and Georgia College and State University.[57] These three colleges charge the highest tuition, but also serve students with higher family incomes and that are the most likely to receive the HOPE scholarship.
Schools with lower borrowing rates and lower loan amounts include many state colleges with lower tuition rates. Schools with both higher borrowing rates and higher loan amounts are typically mid-priced comprehensive and state universities who serve a high share of students from families who lack assets and savings to help pay for college.
In 2014-2015, the university system estimated that even after Pell Grants and assuming federal loans, more than 112,000 students had unmet financial need totaling more than $808 million, or $7,198 per student.[58] Unmet need is the gap between financial need and financial aid, and it is a barrier to college completion.

Conclusion
Georgia can become a more prosperous and economically competitive state by helping more Georgians complete their degrees. Most jobs that can provide financial security and independence will require education or training beyond high school. Yet many Georgians are not prepared to meet this requirement.
The Georgians least likely to have postsecondary credentials live in rural or low-income areas, and they are more likely to be black or Latino. People of all backgrounds value higher education, and enrollment of students from low-income families and students of color continues to grow. Yet disparities in who graduates persist by family income, race and ethnicity. Colleges reflect not only the diversity, but the inequality, of the state.
Colleges can be places of transformation if state policies help remove financial and administrative roadblocks. Smart and fiscally responsible policies that help students achieve their education and career goals can be put in place to help our state’s economy, families and communities thrive.
Endnotes
[1] The University of Georgia Charter, 1785. Retrieved on July 2, 2019 from http://www.libs.uga.edu/hargrett/archives/exhibit/charter/chartertranscription.html
[2] U.S. Census Bureau, American Community Survey 1-Year Estimates, Table S1501. County-level estimates come from 5-year estimates.
[3] GBPI analysis of 2017 American Community Survey PUMS data. Georgia adults 25 years and older with an associate degree or above.
[4] Ladd, H. F. (2012). Education and poverty: Confronting the evidence. Journal of Policy Analysis and Management, 31(2), 203-227.
[5] Hatfield, E. A. (2019, July 10). Desegregation of higher education. New Georgia Encyclopedia. https://www.georgiaencyclopedia.org/articles/history-archaeology/desegregation-higher-education
[6] U.S. Census Bureau, 2017 American Community Survey 1-Year Estimates, Table B20004. Georgia median earnings by educational attainment for population 25 years and older. See also Able, J.R., & Deitz, R. (2019, June 5). Despite rising costs, college is still good investment. [blog post]. https://libertystreeteconomics.newyorkfed.org/2019/06/despite-rising-costs-college-is-still-a-good-investment.html
[7] Trostel, P. (2015). It’s not just the money: The benefits of college education to individuals and society. Lumina Foundation. https://www.luminafoundation.org/files/resources/its-not-just-the-money.pdf. See also Doyle, W.R., & Skinner, B.T. (2017). The Journal of Higher Education. Does Postsecondary Education Result in Civic Benefits?
[8] Chetty, R., et.al. (2017). Mobility report cards: The role of colleges in intergenerational mobility. http://www.equality-of-opportunity.org/papers/coll_mrc_paper.pdf.
[9] Lee, J. (2018, June 12). Overlooked college often a springboard to middle class and beyond [blog post]. https://gbpi.org/2018/overlooked-colleges-often-a-springboard-to-middle-class/.
[10] GBPI analysis of Mobility Report Cards data, https://opportunityinsights.org/data/
[11] Carnevale, A., Jayasundera, T., & Gulish, A. (2016). America’s divided recovery: College haves and have-nots. Georgetown University Center on Education and the Workforce. https://cew.georgetown.edu/cew-reports/americas-divided-recovery/
[12] Goldin, C., & Katz, L.F. (2007). The race between education and technology. (NBER Working Paper No. 12984). https://www.nber.org/papers/w12984.pdf
[13] U.S. Census Bureau, 2017 American Community Survey 1-Year Estimates, Table B20004. Georgia median earnings by educational attainment for population 25 years and older
[14] Blau, F.D., & Kahn, L.M. (2016).The gender wage gap: Extend, trends, and explanations. (NBER Working Paper No. 21913) https://www.nber.org/papers/w21913
[15] University system and technical college system enrollment data.
[16] GBPI analysis of 2017 American Community Survey PUMS data. Georgia median earnings by educational attainment for population 25 years and older. AAPI Georgians are a group that encompass both native Georgians and more recent immigrant families who come to the state with a wide range of educations, incomes and experiences.
[17] Ladd, H. F. (2012). Education and poverty: Confronting the evidence. Journal of Policy Analysis and Management, 31(2), 203-227.
[18] GBPI analysis of University System of Georgia enrollment data and Census population estimates.
[19] GBPI analysis of University System of Georgia enrollment data, 1998-2018 and Census population data, 2000-2018.
[20] GBPI analysis of population projections from Governor’s Office of Planning and Budget. https://opb.georgia.gov/census-data/population-projections
[21] GBPI analysis of population projections from Governor’s Office of Planning and Budget. https://opb.georgia.gov/census-data/population-projections
[22] U.S. Census Bureau, 2017 American Community Survey 1-Year Estimates, Table B19133. Median family income in the past 12 months.
[23] Family income data for undergraduate students provided by the University System of Georgia. Data calculated from information provided by 80 percent of undergraduate students. Georgia median family income data from U.S. Census Bureau, 2017 American Community Survey, 1-year estimates. Table B19113.
[24] Governor’s Office of Student Achievement, Georgia Higher Learning and Earnings dashboard. https://learnearn.gosa.ga.gov/
[25] University System of Georgia Fall 2018 enrollment report, https://www.usg.edu/research/enrollment_reports/
[26] GBPI analysis of University System of Georgia data, Resident Enrollment by Institution and County of Origin. https://www.usg.edu/research/enrollment_reports/. GBPI uses the U.S. Census Bureau’s definition of “rural” to classify counties.
[27] University System of Georgia, Graduation Rate Reports. https://www.usg.edu/research/usgbythenumbers
[28] GBPI analysis of University System of Georgia enrollment data. Two-thirds of Black students in the university system attend a comprehensive university, state university or state college.
[29] Hope Center for College, Community and Justice. (2018). Basic needs security among students attending Georgia colleges and universities. https://hope4college.com/wp-content/uploads/2018/10/GeorgiaSchools-10.16.2018.html
[30] Technical College System of Georgia, End-of-Year Enrollment Report AY 2018.
[31] Data provided by Technical College System of Georgia. Calculated from Fall Semester 2018.
[32] GBPI uses the U.S. Census Bureau’s definition of “rural” to classify counties.
[33] Technical College System of Georgia enrollment report.
[34] U.S. Department of Education, Federal Pell Grant Program 2016-2017 End of Year Report. https://www2.ed.gov/finaid/prof/resources/data/pell-data.html.
[35] Governor’s Office of Student Achievement, Georgia Higher Learning and Earnings dashboard. https://learnearn.gosa.ga.gov/
[36] GBPI analysis of 2018 Census population estimates and TCSG end-of-year annual enrollment report 2018; includes technical division of Bainbridge State College.
[37] University System of Georgia data, Undergraduate Student Transfer Report, 2017-18. https://www.usg.edu/research/student_progression
[38] GBPI analysis of Technical College System of Georgia enrollment reports.
[39] Technical College System of Georgia, End-of-Year Enrollment Report AY 2018.
[40] This includes $282 million for other programs managed by the Board of Regents, including public libraries and agricultural research, services and education.
[41] Technical education funding only. The technical college system manages an additional $40 million for other programs, including educational services for adults without a high school diploma and customized workforce training for Georgia businesses.
[42] GBPI analysis of Georgia’s FY 2020 budget, HB 31.
[43] GBPI analysis of Georgia’s amended fiscal year budgets 2001-2019; Georgia’s FY 2020 budget (HB 31); Board of Regents, University System of Georgia, fall semester enrollment reports 2001-2018, GBPI estimate of fall 2020 enrollment assuming 1 percent growth. Adjusted for inflation
[44] Georgia’s amended fiscal year budgets 2001-2019; Georgia’s FY 2020 budget (HB 31); Technical College System of Georgia, End of Year annual academic year enrollment reports. GBPI estimate of 2019 and 2020 enrollment assuming 0.5 percent growth. Adjusted for inflation.
[45] GBPI analysis of University System of Georgia data, Number of HOPE/Zell Scholarship Recipients by Student Level, Fall 2017. https://www.usg.edu/research/financial_aid/
[46] Georgia Student Finance Commission data, FY 2018.
[47] GBPI analysis of University System of Georgia data. Enrollment by Race and HOPE Status, In-State Residents Undergraduates, Fall 2017.
[48] GBPI analysis of Technical College System of Georgia data.
[49] Data from University System of Georgia, Technical College System of Georgia and Georgia Independent College Association.
[50] U.S. Department of Education, Federal Pell Grant Program 2016-2017 End of Year Report. https://www2.ed.gov/finaid/prof/resources/data/pell-data.html. Sixty-eight percent Pell Grant recipients come from families with income below $30,000 a year. The maximum Pell Grant amount for 2019-2020 is $6,195 total for the academic year.
[51] U.S. Department of Education. Institutions of Education Sciences, National Center for Educations Statistics. Integrated Postsecondary Education Data System (IPEDS), 2016-17, Student Financial Aid Survey. Net prices are calculated after subtracting the average financial aid amount, including HOPE scholarships, Pell Grants and other scholarships awarded by the college, from the total cost of attendance, including living expenses.
[52] GBPI analysis of IPEDS and family income data. See notes 23 and 49.
[53] GBPI analysis of Georgia’s amended fiscal year budgets 2001-2018 and fall semester enrollment reports 2001-2018.
[54] In 2001, working 480 hours at the federal minimum wage of $5.15 per hour resulted in $2,472. Assuming all earnings go to college tuition, this could cover two semesters of tuition and fees at Kennesaw State University, which was $2,428. In 2019, working 480 hours at the federal minimum wage of $7.25 per hour results in $3,480. Tuition for one semester at Kennesaw is $2,781, plus fees totaling $1,003.
[55] University System of Georgia data, Undergraduate Student Loans FY 17-18.
[56] Prosperity Now analysis of U.S. Census Bureau’s Survey of Income and Program Participation. Prosperity Now Scorecard. https://scorecard.prosperitynow.org/
[57] GBPI analysis of University System of Georgia data, Undergraduate Student Loans FY 17-18.
[58] University System of Georgia data.