This report was updated on September 21, 2020 to include additional data on students’ access to high-speed internet.
![]()
Georgia has a constitutional responsibility to provide an adequate and equitable education for all its citizens. The state’s history has seen this obligation selectively applied based on a student’s race, family income and ability. It is worth analyzing if school districts that operate in Georgia’s Black Belt, the location of generations of enslaved labor, are currently being given a square deal. This report displays how communities within the Black Belt were and are systematically disadvantaged compared to the rest of the state of Georgia, and what it might look like to support those affected by systemic discrimination and exclusion.
Many Georgians’ first prolonged interaction with services of the state government occur within the public school system. It was newly freed Black people who first established a universal, state-funded system of education in the Southeast.[1] Perhaps due to these origins, the U.S. experiment of a public system of schools is sold as a meritocracy: where the efforts of the individual, not their race, class or gender, distinguishes them.
This institution is perfectly suited to represent a future for Georgia where all students thrive. The recommendations in this report will not be limited to supporting only those harmed by the effects of slavery but will buoy students in all school systems serving more Black students and students living in poverty than other districts. A system that was built to exclude—via slavery, then segregation—must be reformed with targeted policies that affect those who have been previously left out. With this goal in mind, it is recommended that the state:
- Create an Opportunity Weight to Serve Students Living in Poverty
- Revise Equalization and Sparsity Grants to Better Address District-Specific Needs
- Reinvest in Pre-Kindergarten to Improve Educational Outcomes
Analyses that ground us in the inequitable experience of Black Georgians are critical to eliminating historic and systemic oppression. Georgia must change course to fulfill its constitution and ensure a better future for every student.
Definition of the Black Belt
To define this region of the state is to understand Georgia’s history. In December 1865 the Georgia General Assembly ratified the Thirteenth Amendment to the U.S. Constitution abolishing slavery. Every corner of American life has been affected by the early colonists’ decision to purchase enslaved Africans, but the application of slave labor was concentrated around a band of fertile land in the Southeast. The rich, dark soil of this region helped agriculture thrive. Booker T. Washington is credited with popularizing the name of the area that spans 11 states from Texas to Virginia and runs through Georgia as “The Black Belt.”[2]
Education in the Black Belt: A History of Exclusion
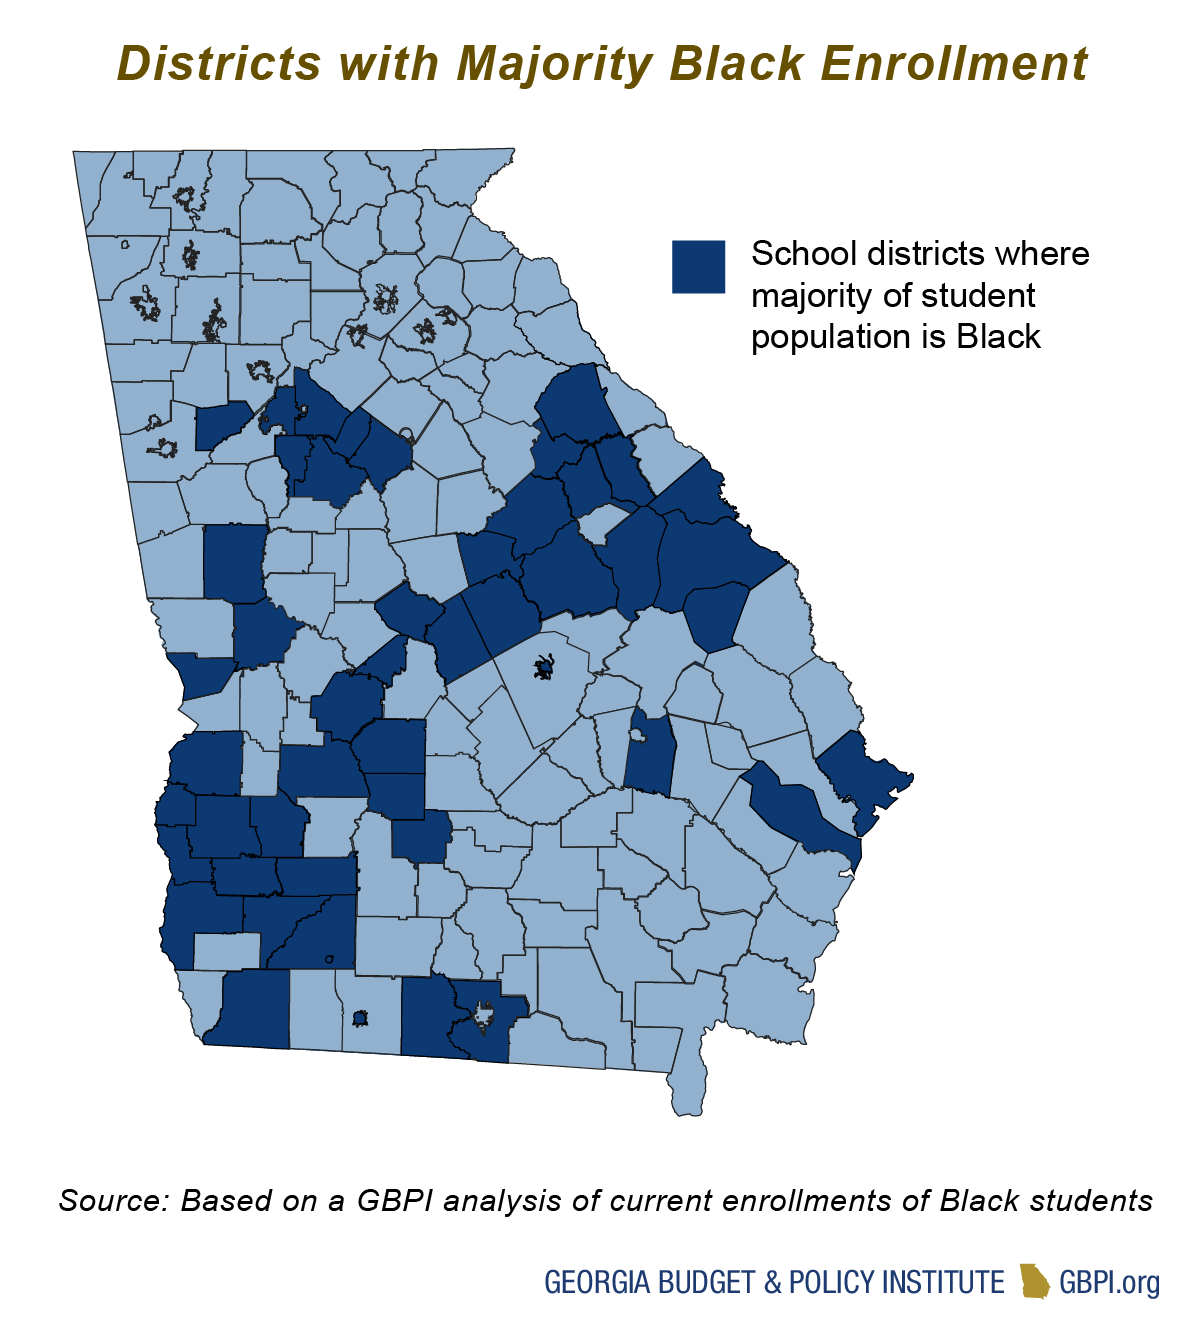
There is no uniform definition for the Black Belt. What began as a regional description based on the coloring and fertility of the soil has morphed into a term to generally describe communities in the Southeast with a majority-Black population or where the majority of people live in poverty.[15] GBPI’s analysis relied on a combination of the historical presence of slavery, current poverty levels and percentage of Black students to define a sample of county and city school districts. The full methodology can be found in Appendix A. A map of the systems included in the Black Belt is below.
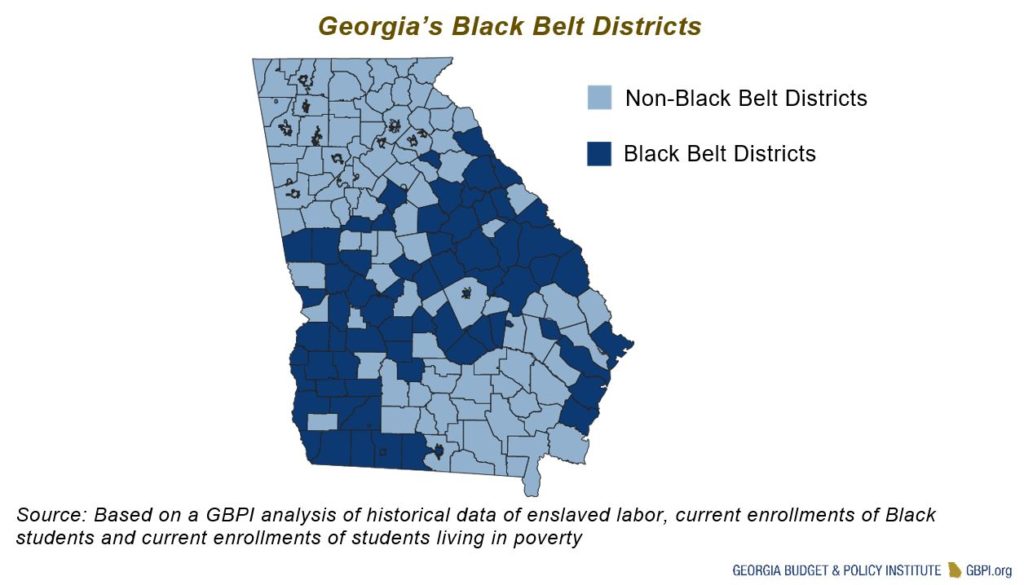
These school systems provide insights into how Georgia’s public education system works for those Georgians who have been historically underserved. While this research is by no means an attempt to speak for the totality of the rural Black experience in Georgia’s public schools, it brings some facets into clearer view. This analysis should be thought of not as a map of the ocean, per se, but a picture of one shoreline. Feedback from school leaders in the Black Belt are used throughout this report to bring that picture into sharper view.[16]
After a review of the demographics in and outside of the Black Belt, this report compares investments and outcomes. Investments are those resources provided to systems so that they can provide a robust education. Outcomes are the results of those investments. If there are measurable differences in school outcomes between groups of students based on race, class and geography, the state should be compelled to act as an equalizing force. A complete explanation of the methods used in this analysis can be found in Appendix B.
Findings
Demographics
By nature of the sample selection, school districts in the Black Belt have smaller enrollments, higher proportions of Black students and higher rates of poverty. A detailed look at the demographics within and outside the Black Belt, as well as the rationale for inclusion in this study, can be found in Appendix C. The Black Belt comprises 69 school districts in 67 counties and serves enough students to fill 279 Georgia high schools. The following table offers a comparison between the Black Belt school districts and the rest of the state of Georgia.
| Student Counts | Average District Enrollment | Percent Economically Disadvantaged | Percent Black | |
| Black Belt | 335,829 | 4,867 | 47.0% | 57.9% |
| Rest of Georgia | 1,381,555 | 12,446 | 26.6% | 31.5% |
Source: Governor’s Office of Student Achievement. (2018). Enrollment by Subgroup Programs
Black Belt Investments
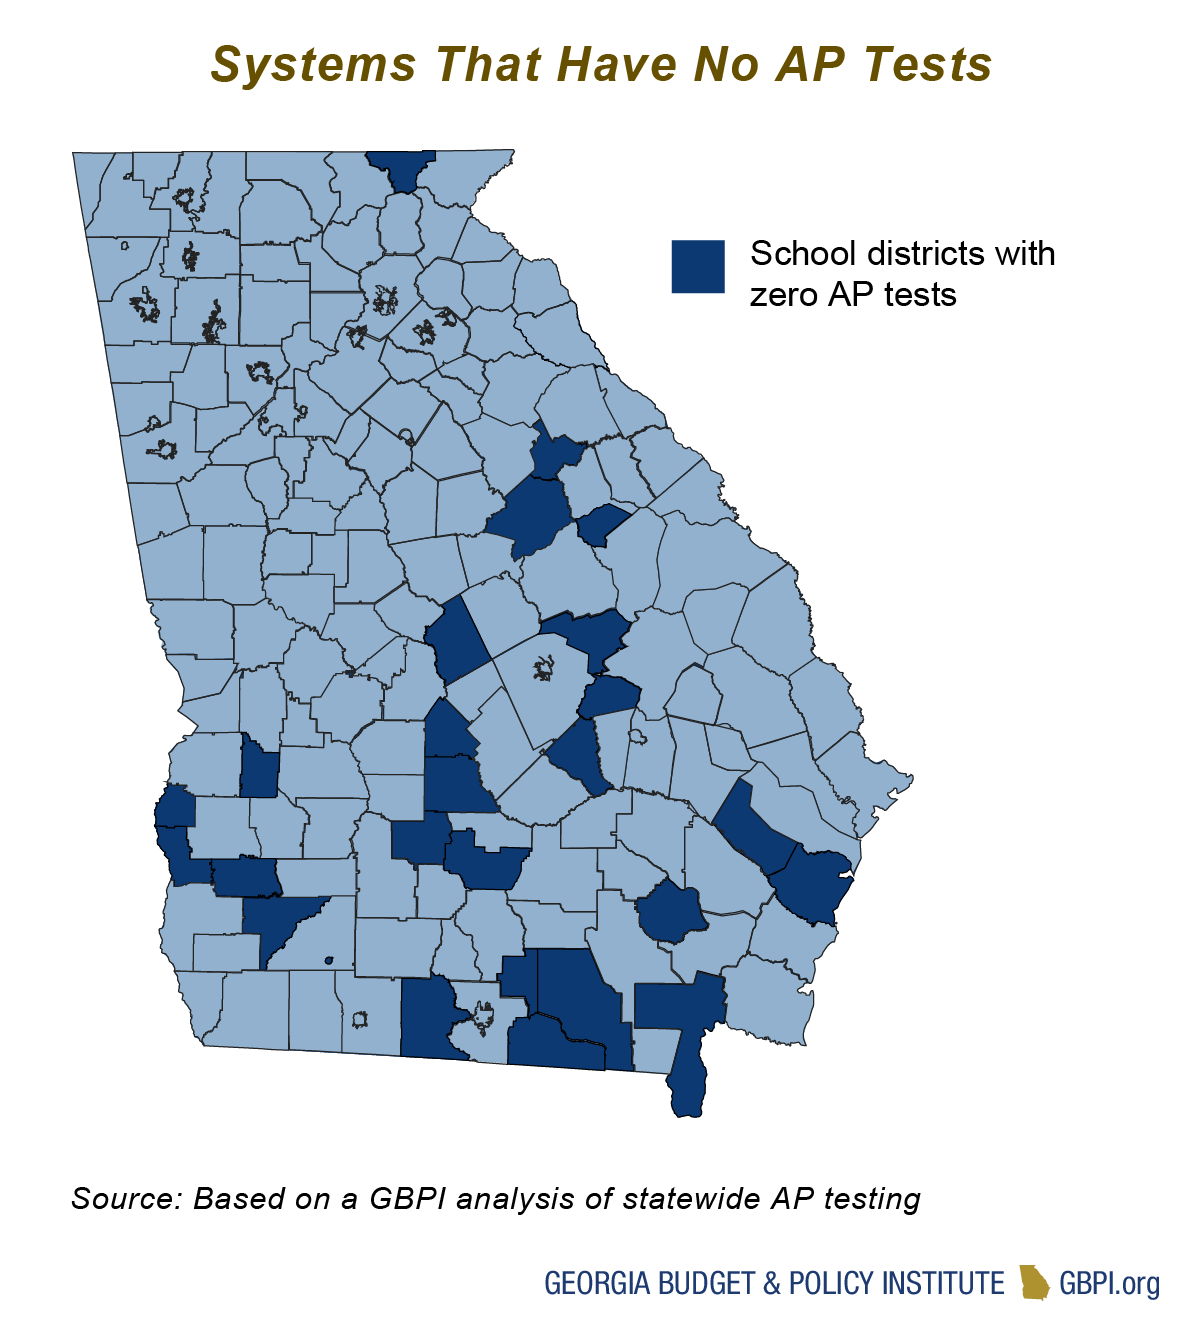
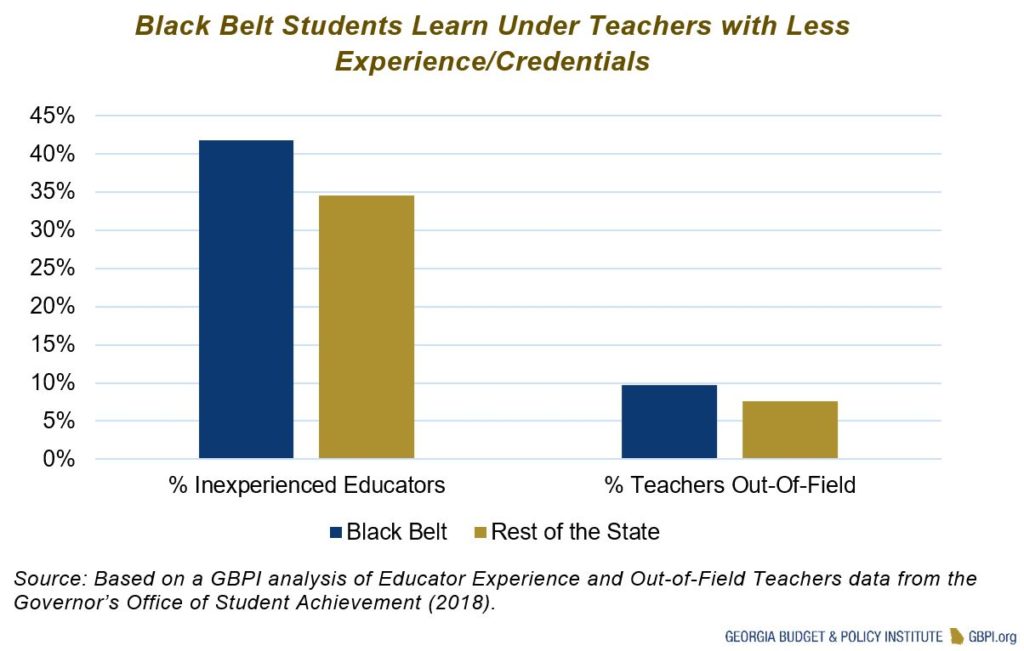
Students in the Black Belt are offered significantly fewer opportunities than their peers in the rest of the state of Georgia. Black Belt students are 21 percent more likely to be taught by teachers with fewer than four years of experience, with 35 percent inexperienced outside the region and 42 percent in the Black Belt.[17] These same children are 28 percent more likely to have teachers that are teaching “out-of-field,” meaning they are not teaching the subject in which they are licensed or certified: 10 percent in the Black Belt compared to 7.6 percent in the rest of the state.[18] These differences can have dramatic effects on student outcomes. Teachers’ experience and credentials significantly influence student grades and future educational attainment.[19] While the average school district outside the Black Belt offers 12 Advanced Placement (AP) courses, districts in the Black Belt average seven courses. Fifteen school districts in the Black Belt, serving 12,700 students, did not have a single student take an AP test in 2018. The Georgia Department of Education records the number of 12th grade students that earn credit for “accelerated enrollment” via Dual Enrollment, AP or International Baccalaureate courses and score the results from 1-100. Black Belt districts average an 85.7 while those outside the region score a 94.5. Challenging classes can provide a first exposure to schooling beyond high school graduation. Evidence shows that the lack of access to rigorous coursework in high school hurts students later in college.[20]
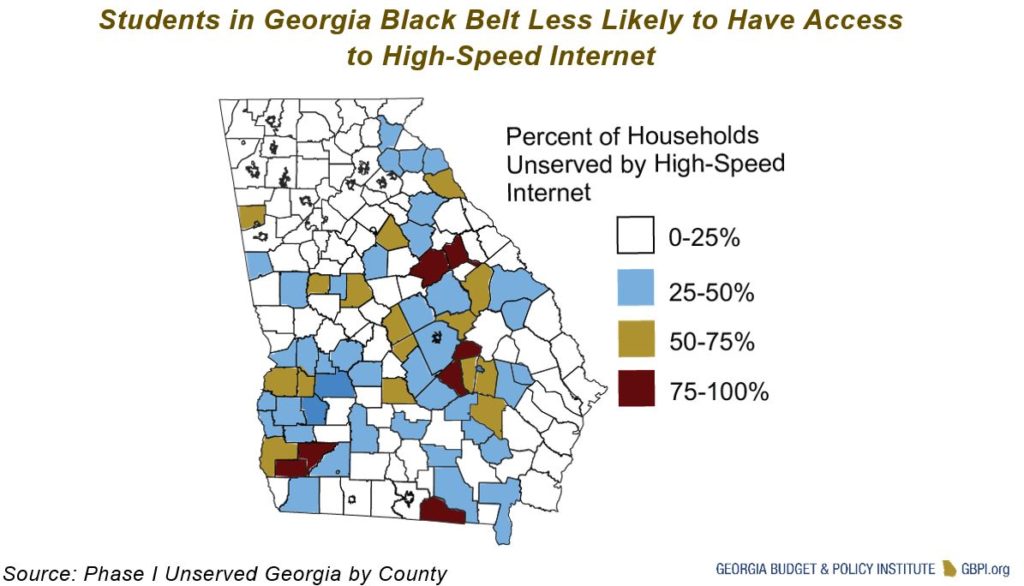
The effort required to do well in school often takes place outside the schoolhouse. Homework represents the most common learning opportunities for children that happen beyond the school’s walls. Similarly, school closures required to protect children (due to weather, public health, etc.) highlight the blurring of the lines between work performed in a school building and that completed in the home. High-speed internet has the opportunity to democratize learning by offering people access to boundless information, and is often relied upon by students, families and schools as students complete school assignments. This opportunity to use the internet to expand education is only available if the internet itself is available to the community.
Households in Black Belt school districts are twice as likely as households outside the region to lack access to high-speed internet. More than 14 percent of all households in the Black Belt lack access, while 6.6 percent of households in the rest of the state are in the same position.[21] The following map shows that unequal educational investments in Georgia’s Black Belt affect a child’s education outside the school as well.
When considering all schools are held to the same standards and expected to accomplish the same results, inequities are clear for students in the Black Belt who experience few opportunities for academic enrichment and learning.
Budgets Affected by Declining Enrollments
Schools within and outside the Black Belt receive comparably similar funding amounts, but any understanding of school budgeting requires significant context. Declining enrollment can produce complicated effects. If 24 students leave a system, the district can lower costs by employing one less teacher in the next year and/or buying 24 fewer textbooks. These are known as variable costs, because they are budget requirements that can be changed with enrollment. However, not all costs are variable. School buildings are often paid for with the expectation that enrollment will remain steady or increase, for example. Schools operate on a mixture of fixed and variable costs. Fixed costs put strain on districts that experience declining enrollment, and districts in the Black Belt have been hit the hardest.
“The costs for electricity, insurance, principals, teachers, counselors, custodians, cafeteria workers, grounds keepers etc. do not go away because students leave … In a small system, if 50 students were to pull out, the system would not be able to reduce the cost of instruction but would receive 50 times FTE fewer dollars.”
– Georgia School Superintendent
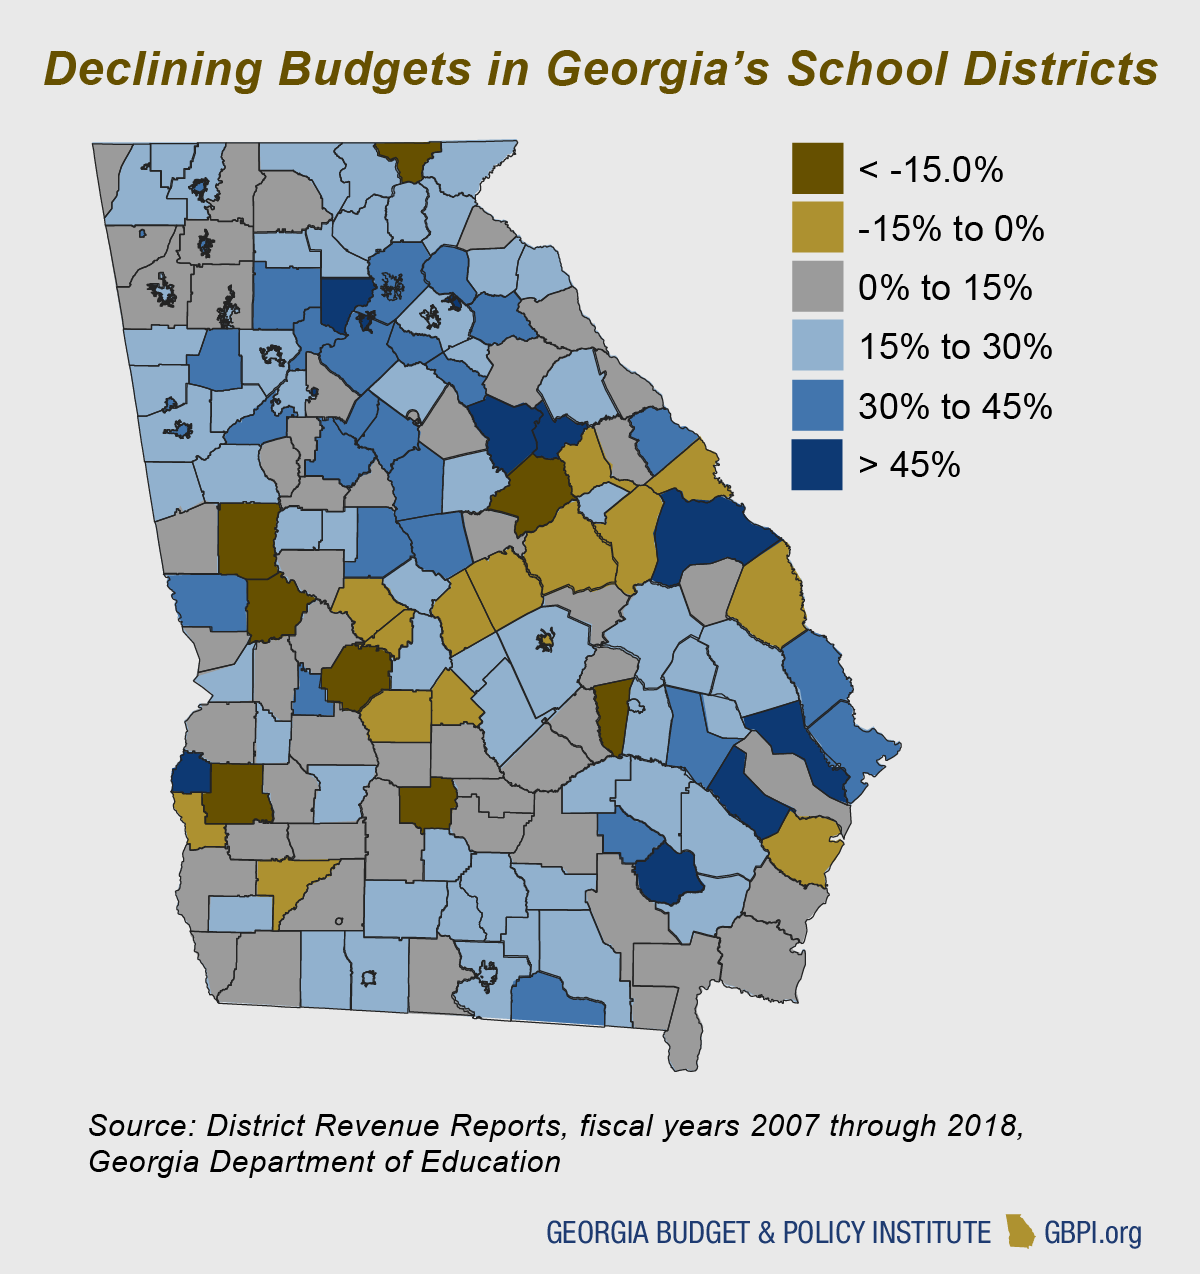
From 2007 to 2018, traditional public school enrollment in Georgia grew by 6.8 percent, or 110,000 students.[22] This growth was concentrated in metro Atlanta school districts. During this same time period districts in the Black Belt have lost 18,000 students (representing 5 percent decrease, enough to fill almost 15 Georgia high schools), while school districts in the rest of the state have gained over 127,000 (10.2 percent increase). Even as government budgets have largely recovered from the declining revenues of the economic downturn, 21 school districts in the Black Belt have less money overall than they had in 2007. Outside the Black Belt, only two school districts’ budgets have declined over that same time. On average the Black Belt districts that lost revenue saw their budgets drop by ten percent from 2007 to 2018 while fixed costs remained constant.[23] The following map shows the concentration of declining budgets in the Black Belt.
Black Belt Outcomes: Consequences of Disadvantage
A superficial review of student outcomes within and outside of the Black Belt would conclude that students in the Black Belt do not perform as well as their counterparts throughout the rest of the state. However, while test scores are lower in the Black Belt, these results are closely related to the level of parental income and not academic ability.
In Georgia there is a strong relationship between the percentage of students living in poverty and school performance on noteworthy state assessments such as 3rd grade English/Language Arts.[24] The Georgia Department of Education has a measure of student growth, Student Growth Percentiles (SGPs), which serves as a better evaluation of how much a child has improved throughout the school year than measuring whether a student “passes” a state test. Based on SGPs results, there exists no relationship between the percentage of students living in poverty and whether those students exhibit “typical” or “high” growth. Put simply, any difference in test scores between the Black Belt and the rest of the state is best explained by the percentage of students living in poverty, not intelligence.
Any difference in test scores between Black Belt and the rest of the state is best explained by the percentage of students living in poverty, not intelligence.
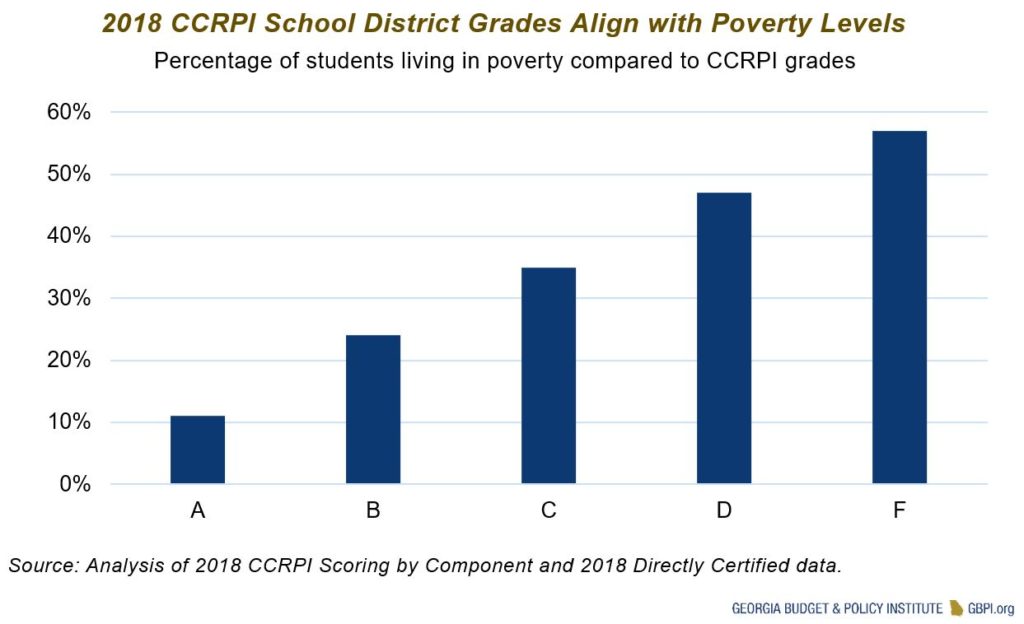
State laws require the Georgia Department of Education to grade every school system using the College and Career Readiness Performance Index (CCRPI). CCRPI overwhelmingly relies on test score data and is therefore a better measure of the wealth of a school system than the school staff’s ability to educate students. The chart below shows the strong relationship between CCRPI scores and the percentage of students living in poverty. Since CCRPI and the test scores it uses for the calculation are used as a measure to dictate certain state policies toward schools, it follows that they are worth review.
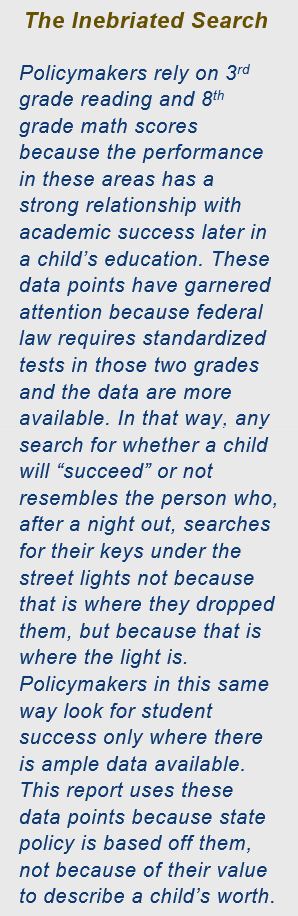 Two data points that policymakers constantly use to signal the health of a student’s education is their performance on 3rd grade reading and 8th grade mathematics. A quarter (25.6 percent) of 3rd grade students in the Black Belt score “proficient” or higher on the state assessment for English/Language Arts. Outside the Black Belt, 40.4 percent of students achieve proficient or higher. The apparent gap in scores narrows slightly in middle grades: 24 percent of Black Belt students score proficient or higher in 8th grade mathematics while 38 percent score the same outside the Black Belt.
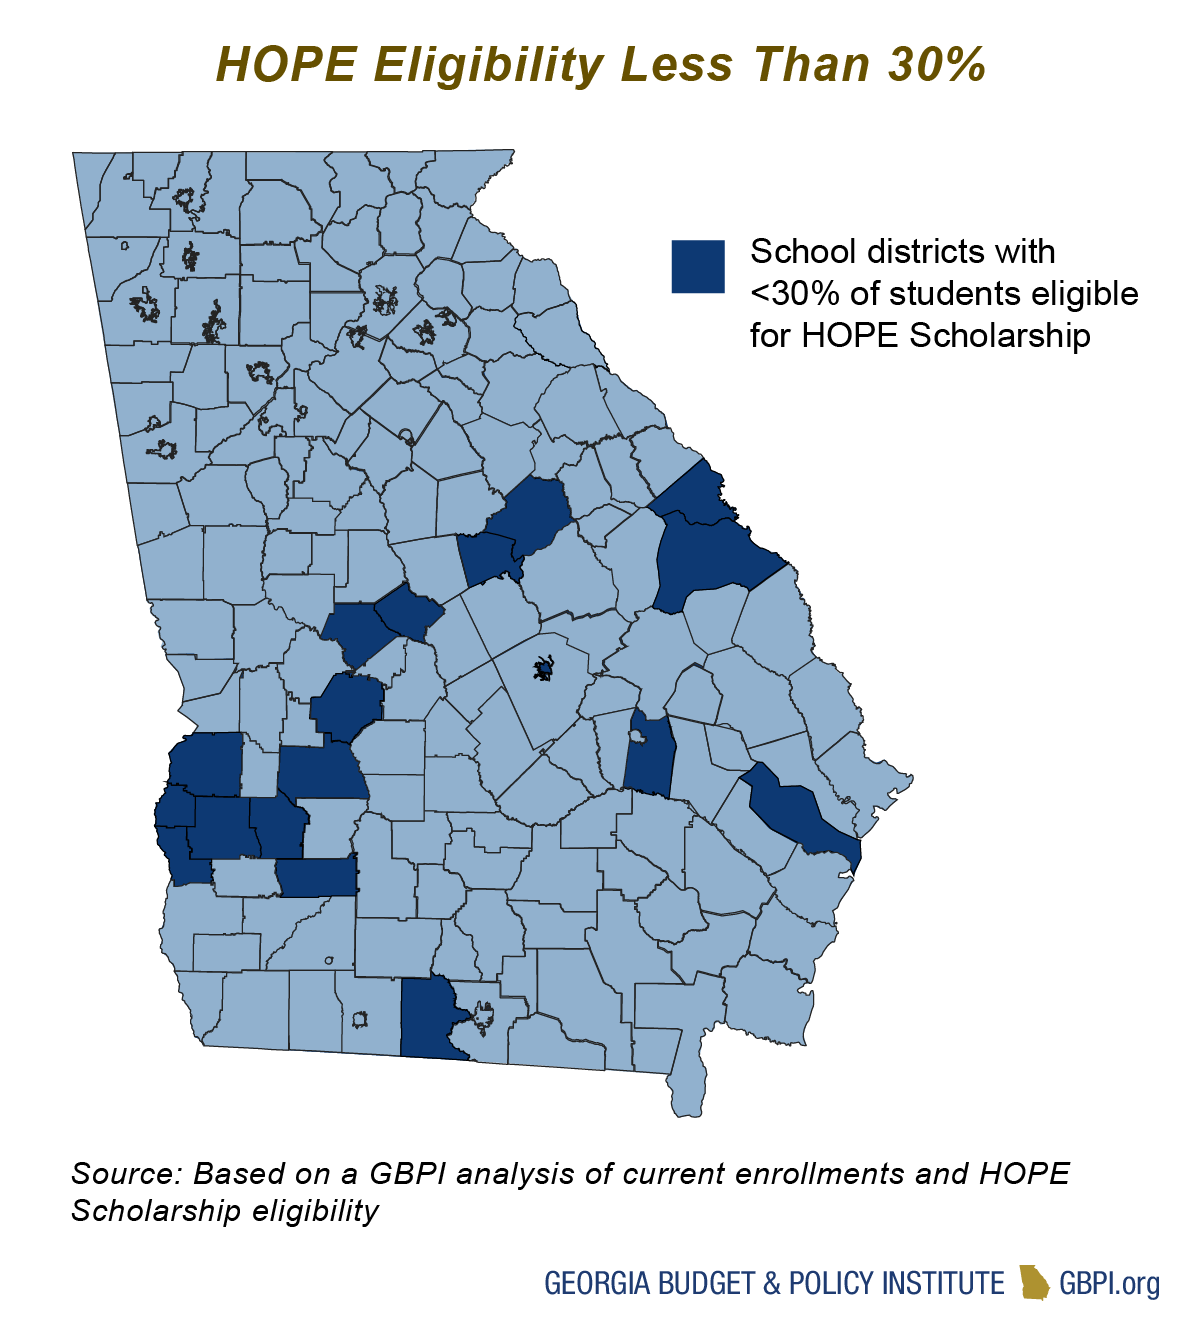
When students matriculate to high school, differences between the education systems in these regions continue to show up. More than 61 percent of students that took AP courses outside the Black Belt achieved a passing score. In the Black Belt, where the courses are already rarer, this percentage drops to 40 percent.[25] As graduates prepare to leave high school, the HOPE Scholarship can often be a lifeline to college and the promise of economic mobility. Thirty-six percent of graduates in the Black Belt were eligible for the HOPE Scholarship in 2018, compared to 47 percent in the rest of the state.[26] The Black Belt holds 16 school districts where less than 30 percent of graduates are HOPE eligible while there are only two such districts in the rest of the state. Those 16 districts serve 30 percent of the region’s enrollment while the two districts outside of the Black Belt educate less than one percent of the rest of the state.
Tests cannot measure the total value of student learning or experiences. The combined effect of these disparate outcomes coupled with the fact that these scores say more about family income than intelligence demonstrates that students in the Black Belt are being shortchanged. The data on the Black Belt are difficult to process, but unsurprising considering the region’s history. What comes next is how Georgia policymakers must respond to this data.
A Path Forward: Targeted Policy Solutions to Better Serve Students
There is a pernicious belief that money does not matter in education. This idea is categorically false. A robust body of research has shown that investing in public education does in fact strongly correlate to higher student outcomes.[27] If the state of Georgia is serious about treating every student equally, then the budget will need to reflect that belief. What follows are three recommendations to match the seriousness of the issue at hand:
- Create an Opportunity Weight to Serve Students Living in Poverty
- Revise Equalization and Sparsity Grants to Better Address District-Specific Needs
- Reinvest in Pre-Kindergarten to Improve Educational Outcomes
These policy options are not exhaustive—many initiatives like recruiting Black teachers and school leaders would also support these districts—but focus on the state’s budget as a signal to the state’s priorities. Investments like these may seem expensive, but they are nowhere near as costly as doing nothing. Every dollar spent ensuring all students receive an excellent education, regardless of race, ethnicity, zip code or economic status, saves $2.60 due to increased tax revenues and decreased need for safety net programs.[28] Significant public commitment to school funding has the ability to pay for itself in future economic growth.[29] The general public also supports investments in education. In a national survey, 62 percent of respondents believe that K-12 spending should increase significantly.[30] In Georgia, 69 percent of those polled support a state school funding formula that sends more funds to school districts that serve a high number of students in poverty.[31]
Create an Opportunity Weight to Serve Students Living in Poverty
Georgia is one of only eight states that do not provide additional money to schools for students living in poverty.[32] Evidence proves that there is a link between a student’s family income and their ability to succeed in education. Currently, Georgia offers relatively small amounts of funding for students that fall behind their grade level. This money is often insufficient, restricted by onerous regulations and/or caps, and it addresses disparities after they appear, rather than preventing them.[33] Additional money in the school funding formula specifically for students living in poverty would help improve outcomes for those in the Black Belt. If the state of Georgia committed to funding an “opportunity weight” research has shown that student achievement would increase measurably.[34]
“We operate on a very tight budget with 90% of our budget going to salaries and benefits. We do not have enough money left over to fund all of the needed programs and initiatives. We have a difficult time retaining faculty because one person may have to do two, three, and even four jobs due to lack of funds. We definitely need all of the funds that are available…”
– Georgia School Superintendent
Instead of waiting on students to fall behind to earn additional money, schools could preemptively address needs that students living in poverty experience. Georgia students who live in poverty experience more housing instability, lack access to high-quality out-of-school resources and are more likely to face toxic stress, which all impede success in school.[35] While the federal government provides some funds for schools to meet these needs, these programs can be inefficient due to regulations. In contrast, state funds for students who come from low-income households could be supplied directly to districts to meet the unique needs of their students.
An opportunity weight would also allow school leaders to move away from a deficit mindset toward one focused on academic acceleration. Remediation funding calls to mind a net, catching all students that have been unable to keep up. Oftentimes, these students may simply need the same attention and creativity that schools provide in programs like gifted education. Exposing children to new and exciting topics pays dividends in all facets of their education.[36]
Revise Equalization and Sparsity Grants to Better Address District-Specific Needs
Low-wealth school districts face challenges raising money to provide students an adequate education because they tend to raise less revenue via local property taxes. Georgia’s school funding formula aims to take these disparities into account and offers grants to equalize funding across the state. School systems can spend these equalization grants as they see fit. In the last 20 years, Georgia lawmakers lowered the amount of equalization dollars so much that if the original calculation of the grant were in place today, local districts would be allotted more than $3.4 billion more annually than they currently receive.[37] For more information on equalization grants, see “Georgia’s K-12 Equalization Grants Explained.”
Similarly, sparsity grants intend to support those districts that face unique challenges due to smaller enrollments. Considering the declining enrollment in Georgia’s Black Belt, sparsity grants might make the difference between a school addressing the needs of the student and the needs of the building. This grant is limited and has not seriously changed in decades. New research has shown that even modest increases in how states fund sparse districts can have significant effects on student performance.[38]
“[The sparsity grant] is very important to our district. We are a small district with limited funding. Without sparsity we would have to cut the budget which would more than likely mean we would lose some employees. ”
– Georgia School Superintendent
Policymakers must update this formula for the 21st century school district. Smaller districts face steep fixed costs, and the state should bolster the grant to recognize the financial stress of declining enrollments. Both equalization and sparsity grants act as lifelines to many of the smaller, low-property wealth districts in the Black Belt. Any changes to these grants should be undertaken after careful consideration of the unique needs across the state. Bringing these grants into the current century would pay dividends for the districts, as they represent funds that can be spent how district leaders see fit without programmatic requirements.
Reinvest in Pre-Kindergarten to Improve Educational Outcomes
Children in rural Georgia have higher barriers to experiences that can enrich their early learning years. Pre-Kindergarten also means more to families living in poverty than to wealthy Georgians. While wealthier families might be able to afford to provide a holistic education when pre-K is unavailable, families struggling with under- or unemployment do not have the same luxury.[39] For these reasons any money allocated to pre-K in the state will support the Black Belt where pre-K seats come at a premium.
Currently, assistant pre-Kindergarten (pre-K) teachers are allotted a little more than $16,000 a year for salary. Lead teachers are paid similar wages to first-year K-12 teachers but have fewer opportunities for pay increases. Georgia is ranked 27th in the nation in state spending for preschool services, and 35th for total spending.[40] As more research recognizes the importance of pre-K on a child’s educational development, policymakers must allocate additional funds to these positions.[41] Georgia’s spending for pre-K is $822 less per student than a decade prior, a trend that must be reversed if the state wants to support rural Black Belt districts.[42]
Conclusion
Georgia has an opportunity to lead the Southeast and the nation in supporting all schoolchildren through robust and targeted supports. These policy recommendations are economically responsible: financial investments in the schooling years of a child’s life produce large dividends for the state. However, the primary argument for dramatic state intervention is a moral one and is a commitment enshrined in the state constitution.
It cannot be lost that the modern ideal for public schooling is one that stems from the once-enslaved population. Upon emancipation, formerly enslaved people waged a campaign for universal education. During Reconstruction, Black legislators in the South worked to pass compulsory education laws.[43] It was for this reason that W.E.B. Du Bois stated, “Public education for all at public expense was, in the South, a Negro Idea.”[44]
Public schools in the United States have represented opportunity since their inception. Unfortunately, public schooling in Georgia and across the nation has also represented spaces where certain people were not allowed or welcome. The consequences of this attitude remain. Georgia has a higher percentage of students eligible for free- and reduced-price lunch, a traditional measure of school-aged poverty, than all but three states.[45] Students of color generally and Black students specifically are many times more likely to be poor than white students.[46] The cumulative effect of slavery, Jim Crow legislation, school and housing segregation, explicit and implicit bias and more resulted in a generation that, while descended from those who built and enriched Georgia through enslaved labor, have not been granted access to those riches.
State policies in the past created two Georgias: one for Black people and another for white people. These state financial investments in education would not right these many wrongs, but it would overwhelmingly flow to serving students of color and would provide some relief. Georgia lawmakers can take a deliberate step in recognizing the past and preparing a future where the school represents something new altogether: a community.
Appendix A: Sample Selection
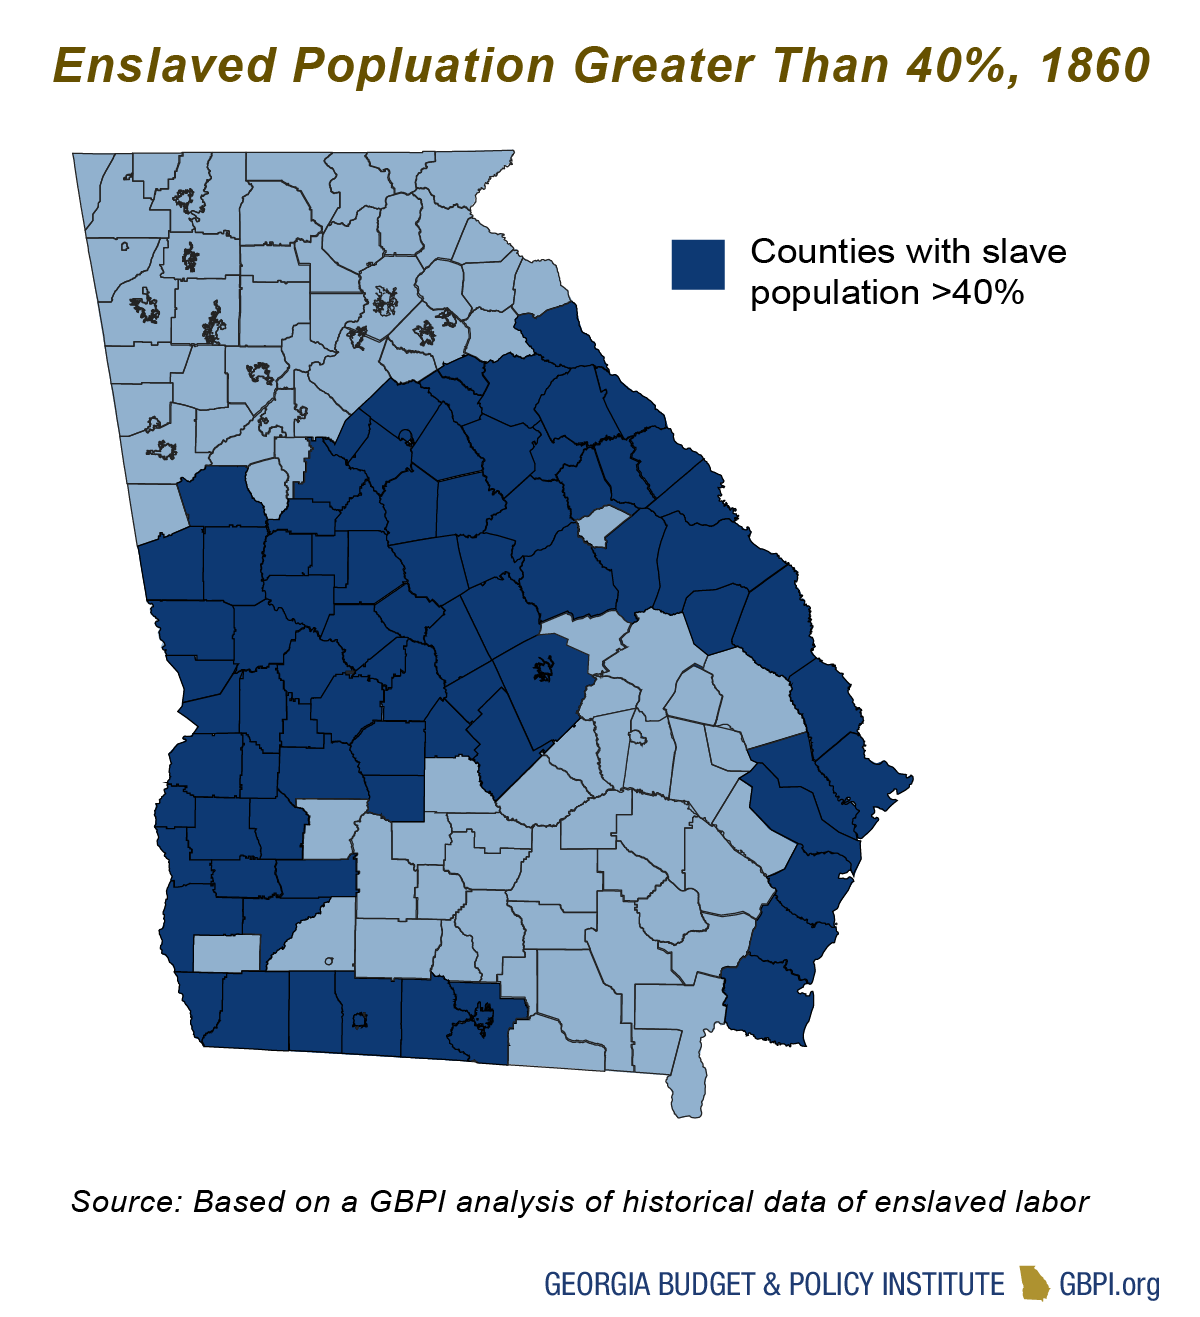
This analysis relied on three measures to select the Black Belt school systems: historical data of enslaved labor, current enrollments of Black students and current enrollments of students living in poverty. School systems were considered if they had one of the following criteria: a majority-Black student population, majority of students living in poverty and a history of enslaved labor. Enslaved labor data is based on the 1860 U.S. Census data of the distribution of enslaved populations. A review of the data showed a normal distribution of enslaved people as a portion of the population except for a dip in the number of counties with 30 to 39 percent enslaved. The following chart displays the drop in enslaved populations and the subsequent increase in the number of counties that held 40 to 49 percent enslaved people.
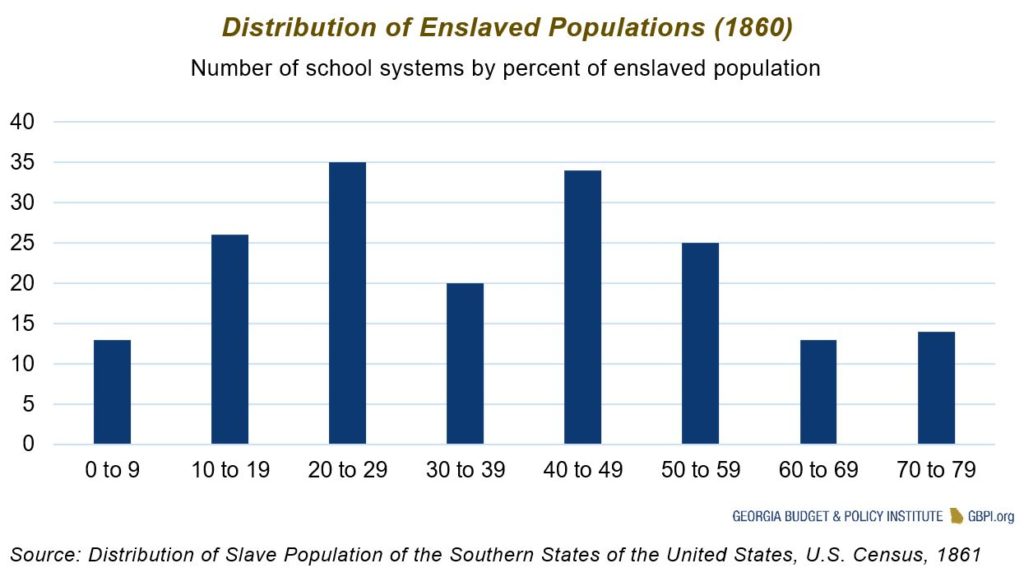
This sharp increase of counties and cities that contained more than 40 percent of their population enslaved made for a natural threshold for this analysis. This analysis considered all school systems that currently operate in an area that previously had enslaved people greater than 40 percent of the population as having a history of slavery.
School systems that met two of the criteria were included in the selection. Of the remaining systems, the current enrollment had to exceed 30 percent Black and 30 percent living in poverty. This threshold made it possible that even if the school system were not majority Black, Black students might represent a plurality of the student body. Metro Atlanta school systems were excluded due to the unique challenges and opportunities that come with educating in the region. A table with the data is below, with Black Belt districts in bold.
| System Name | Slave Population (1860) | Percent Black (2018) | Percent in Poverty (2018) |
| Appling County | 18% | 23% | 44% |
| Atkinson County | 23% | 16% | 43% |
| Atlanta Public Schools | 17% | 74% | 52% |
| Bacon County | 18% | 22% | 43% |
| Baker County | 70% | 64% | 68% |
| Baldwin County | 55% | 66% | 53% |
| Banks County | 23% | 2% | 28% |
| Barrow County | 32% | 13% | 25% |
| Bartow County | 27% | 10% | 26% |
| Ben Hill County | 15% | 42% | 48% |
| Berrien County | 13% | 12% | 40% |
| Bibb County | 42% | 73% | 55% |
| Bleckley County | 47% | 26% | 37% |
| Brantley County | 20% | 3% | 40% |
| Bremen City | 8% | 6% | 13% |
| Brooks County | 52% | 53% | 54% |
| Bryan County | 59% | 16% | 14% |
| Buford City | 20% | 11% | 15% |
| Bulloch County | 38% | 37% | 39% |
| Burke County | 71% | 65% | 52% |
| Butts County | 48% | 32% | 41% |
| Calhoun City | 21% | 6% | 23% |
| Calhoun County | 56% | 93% | 74% |
| Camden County | 77% | 22% | 27% |
| Candler County | 27% | 29% | 46% |
| Carroll County | 16% | 17% | 29% |
| Carrollton City | 16% | 33% | 29% |
| Cartersville City | 27% | 23% | 24% |
| Catoosa County | 14% | 3% | 23% |
| Charlton County | 31% | 29% | 38% |
| Chatham County | 49% | 57% | 40% |
| Chattahoochee County | 48% | 27% | 32% |
| Chattooga County | 29% | 9% | 44% |
| Cherokee County | 11% | 8% | 10% |
| Chickamauga City | 15% | 0% | 11% |
| Clarke County | 51% | 49% | 46% |
| Clay County | 46% | 95% | 74% |
| Clayton County | 28% | 70% | 42% |
| Clinch County | 15% | 34% | 46% |
| Cobb County | 27% | 31% | 15% |
| Coffee County | 23% | 31% | 45% |
| Colquitt County | 8% | 27% | 49% |
| Columbia County | 70% | 20% | 15% |
| Commerce City | 32% | 11% | 27% |
| Cook County | 13% | 33% | 46% |
| Coweta County | 49% | 23% | 20% |
| Crawford County | 56% | 22% | 40% |
| Crisp County | 46% | 58% | 50% |
| Dade County | 10% | 1% | 22% |
| Dalton City | 17% | 5% | 18% |
| Dawson County | 9% | 1% | 22% |
| Decatur City | 26% | 21% | 9% |
| Decatur County | 50% | 50% | 49% |
| DeKalb County | 26% | 62% | 41% |
| Dodge County | 47% | 35% | 45% |
| Dooly County | 46% | 72% | 52% |
| Dougherty County | 73% | 89% | 64% |
| Douglas County | 24% | 53% | 28% |
| Dublin City | 47% | 91% | 72% |
| Early County | 66% | 70% | 59% |
| Echols County | 21% | 2% | 52% |
| Effingham County | 46% | 15% | 20% |
| Elbert County | 55% | 34% | 42% |
| Emanuel County | 26% | 42% | 53% |
| Evans County | 27% | 35% | 54% |
| Fannin County | 3% | 0% | 31% |
| Fayette County | 29% | 28% | 11% |
| Floyd County | 39% | 7% | 28% |
| Forsyth County | 12% | 4% | 6% |
| Franklin County | 18% | 10% | 36% |
| Fulton County | 17% | 42% | 23% |
| Gainesville City | 14% | 18% | 35% |
| Gilmer County | 3% | 0% | 26% |
| Glascock County | 31% | 8% | 29% |
| Glynn County | 73% | 35% | 38% |
| Gordon County | 21% | 2% | 28% |
| Grady County | 58% | 34% | 46% |
| Greene County | 67% | 47% | 41% |
| Gwinnett County | 20% | 32% | 20% |
| Habersham County | 13% | 2% | 29% |
| Hall County | 14% | 5% | 23% |
| Hancock County | 68% | 96% | 63% |
| Haralson County | 8% | 2% | 40% |
| Harris County | 56% | 16% | 16% |
| Hart County | 25% | 23% | 36% |
| Heard County | 36% | 9% | 36% |
| Henry County | 42% | 53% | 25% |
| Houston County | 69% | 38% | 30% |
| Irwin County | 15% | 32% | 42% |
| Jackson County | 32% | 6% | 25% |
| Jasper County | 65% | 23% | 41% |
| Jeff Davis County | 23% | 15% | 43% |
| Jefferson City | 32% | 8% | 13% |
| Jefferson County | 59% | 68% | 56% |
| Jenkins County | 71% | 52% | 55% |
| Johnson County | 29% | 42% | 50% |
| Jones County | 66% | 25% | 29% |
| Lamar County | 47% | 32% | 37% |
| Lanier County | 30% | 25% | 43% |
| Laurens County | 47% | 29% | 39% |
| Lee County | 52% | 21% | 28% |
| Liberty County | 73% | 53% | 36% |
| Lincoln County | 69% | 38% | 40% |
| Long County | 74% | 26% | 38% |
| Lowndes County | 46% | 22% | 28% |
| Lumpkin County | 9% | 1% | 28% |
| Macon County | 58% | 81% | 53% |
| Madison County | 34% | 9% | 33% |
| Marietta City | 27% | 39% | 23% |
| Marion County | 48% | 34% | 42% |
| McDuffie County | 70% | 55% | 52% |
| McIntosh County | 74% | 42% | 44% |
| Meriwether County | 57% | 58% | 45% |
| Miller County | 36% | 38% | 46% |
| Mitchell County | 37% | 59% | 54% |
| Monroe County | 64% | 24% | 38% |
| Montgomery County | 33% | 32% | 56% |
| Morgan County | 70% | 26% | 30% |
| Murray County | 20% | 0% | 29% |
| Muscogee County | 45% | 58% | 40% |
| Newton County | 45% | 56% | 40% |
| Oconee County | 51% | 4% | 9% |
| Oglethorpe County | 65% | 17% | 33% |
| Paulding County | 8% | 24% | 19% |
| Peach County | 56% | 51% | 46% |
| Pelham City | 37% | 56% | 55% |
| Pickens County | 5% | 1% | 24% |
| Pierce County | 12% | 9% | 33% |
| Pike County | 47% | 8% | 21% |
| Polk County | 39% | 14% | 42% |
| Pulaski County | 47% | 40% | 50% |
| Putnam County | 71% | 37% | 47% |
| Quitman County | 47% | 72% | 57% |
| Rabun County | 6% | 1% | 33% |
| Randolph County | 47% | 96% | 66% |
| Richmond County | 40% | 74% | 52% |
| Rockdale County | 45% | 67% | 39% |
| Rome City | 39% | 35% | 38% |
| Schley County | 51% | 16% | 26% |
| Screven County | 55% | 47% | 47% |
| Seminole County | 50% | 41% | 50% |
| Social Circle City | 42% | 22% | 29% |
| Spalding County | 44% | 47% | 45% |
| Stephens County | 13% | 13% | 40% |
| Stewart County | 59% | 95% | 61% |
| Sumter County | 52% | 72% | 57% |
| Talbot County | 63% | 91% | 53% |
| Taliaferro County | 63% | 77% | 61% |
| Tattnall County | 27% | 25% | 46% |
| Taylor County | 40% | 41% | 42% |
| Telfair County | 31% | 41% | 52% |
| Terrell County | 46% | 93% | 74% |
| Thomas County | 58% | 35% | 41% |
| Thomaston-Upson County | 49% | 35% | 42% |
| Thomasville City | 58% | 57% | 41% |
| Tift County | 23% | 35% | 44% |
| Toombs County | 27% | 18% | 54% |
| Towns County | 4% | 1% | 29% |
| Treutlen County | 33% | 40% | 47% |
| Trion City | 29% | 1% | 15% |
| Troup County | 62% | 43% | 36% |
| Turner County | 23% | 63% | 57% |
| Twiggs County | 65% | 62% | 55% |
| Union County | 3% | 0% | 24% |
| Valdosta City | 46% | 75% | 59% |
| Vidalia City | 27% | 50% | 43% |
| Walker County | 15% | 6% | 30% |
| Walton County | 42% | 23% | 27% |
| Ware County | 17% | 36% | 48% |
| Warren County | 55% | 91% | 67% |
| Washington County | 52% | 64% | 50% |
| Wayne County | 28% | 22% | 41% |
| Webster County | 46% | 44% | 45% |
| Wheeler County | 33% | 36% | 49% |
| White County | 8% | 2% | 30% |
| Whitfield County | 17% | 1% | 20% |
| Wilcox County | 20% | 34% | 44% |
| Wilkes County | 70% | 51% | 49% |
| Wilkinson County | 42% | 55% | 52% |
| Worth County | 23% | 34% | 46% |
Source: Institute of Taxation and Economic Policy, February 2019; “Who Pays? A Distributional Analysis of the Tax Systems in All 50 States,” Institute on Taxation and Economic Policy, October 2018
Appendix B: Methods
This analysis focuses on K-12 public education funding and outcomes as a measure of the state’s responsibility to its citizens. Schools operate in a complex environment of federal and state laws and local district decisions. The state constitution outlines the ultimate responsibility for public education, however.
For decades school finance experts studied state funding systems by comparing inputs, or investments, meaning that two similar students, regardless of the location of their schools, should be provided similar funding amounts.[47] Additionally, if there were notable differences between students that affected the school program each would require, then different funding amounts might also be required. It is for this very reason that students with disabilities are provided more funding than students without disabilities.[48] This focus on inputs led to the McDaniel case mentioned in the report’s timeline. The McDaniel case was a primary driver for state policymakers to draft and pass the Quality Basic Education Act, an overhaul to the state’s education funding formula, in 1985.[49]
More recently, education finance has been analyzed through outputs, or outcomes. Instead of solely judging a funding system by the amount of money provided, states have been held accountable for the level of student performance.[50] The question no longer stops at whether funding amounts are equal, but whether they are adequate to produce high levels of learning for students across the state. This analysis considers various inputs such as staffing, budgets and educational opportunities, but the focus remains on outputs.
Appendix C: Demographics
District Enrollment
The average Black Belt district enrollment in 2018 was 4,867 students, but that number is skewed by nine larger districts in the region. The median school district in the Black Belt enrolls 2,227 students and 14 Black Belt districts educate fewer than 1,000 students each. For the rest of Georgia, the average district enrolls 12,446 students—two and a half times the size of those districts in the sample. The median district educates 4,224 students and five districts outside of the region educate fewer than 1,000 students.
Socioeconomic Status
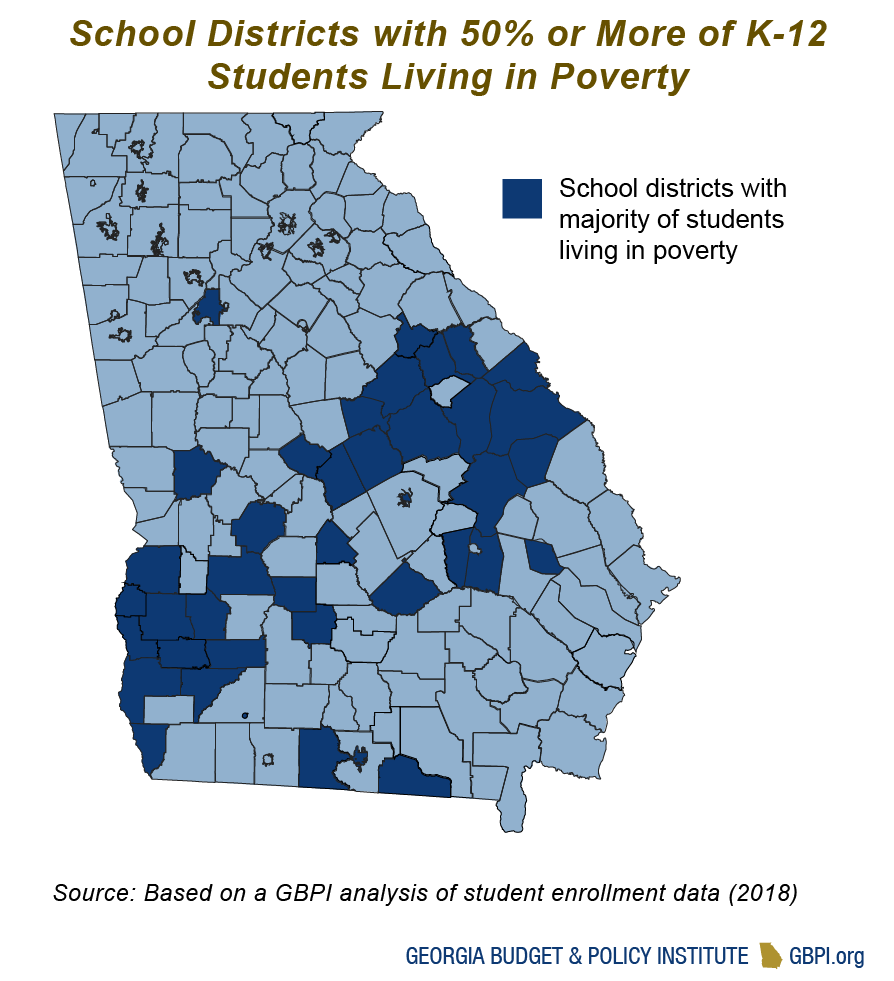
The Governor’s Office of Student Achievement uses a metric—direct certification—to count the number of students living in poverty. A student who is “directly certified” receives Supplemental Nutrition Assistance Program (SNAP, formerly food stamps) or Temporary Assistance for Needy Families (TANF) benefits, or is homeless, an unaccompanied youth, foster youth or migrant.[51] Forty-seven percent of students in the Black Belt are directly certified, while 26.6 percent of students in the rest of the state meet that designation. Of the 68 school districts in the Black Belt, 38 (52 percent) have most of their students living in poverty by this measure. Outside of the region, only three school districts have more than 50 percent of their students directly certified.
Race
Throughout Georgia’s entire public school system, 40 percent of students are white, 37 percent are Black, 16 percent are categorized as Hispanic and the remaining 7 percent are evenly split between Asian students and those who are multiracial. While the Black Belt educates 31 percent of the total number of Black students in the state, these students make up 58 percent of the districts’ enrollments. Outside of the sample, Black students comprise less than a third of the enrollment (31.5 percent). Districts outside the Black Belt serve a larger proportion of students in English for Speakers of Other Languages (ESOL) programs: 6.8 percent of enrollment outside the region and 2.6 percent within.
Ability
Programs such as those that serve students with disabilities have similar percentages of students in and outside the Black Belt.
Taken together, the districts inside the Black Belt serve a population of students that is distinct from the rest of the state of Georgia, most notably in race, class and district size.
Endnotes
[1] Hannah-Jones, N. (2019). The 1619 Project. The New York Times. Retrieved from https://www.nytimes.com/interactive/2019/08/14/magazine/black-history-american-democracy.html
[2] Tullos, A. (2004). The Black Belt. Retrieved from https://southernspaces.org/2004/black-belt
[3] Georgia Constitution. (2002). New Georgia Encyclopedia. Retrieved September 2, 2019, from https://www.georgiaencyclopedia.org/articles/government-politics/georgia-constitution
[4] Plessy v. Ferguson, 163 U.S. 537 (1896).
[5] Carson, C. (Ed.). (2003). Civil rights chronicle: The African-American struggle for freedom. Omnigraphics Incorporated.
[6] Johnson, R. O. (1955). Desegregation of Public Education in Georgia–One Year Afterward. The Journal of Negro Education, 24(3), 228-247.
[7] Carson, C. (Ed.). (2003). Civil rights chronicle: The African-American struggle for freedom. Omnigraphics Incorporated.
[8] Ibid.
[9] Ibid.
[10] The Green Decision of 1968. (n.d.). The Civil Rights Movement in Virginia. The Virginia Historical Society. Retrieved September 5, 2019, from https://www.virginiahistory.org/collections-and-resources/virginia-history-explorer/civil-rights-movement-virginia/green-decision
[11] Based on a GBPI analysis of American Community Survey data.
[12] Cornelius, L. M., & Robinson, C. B. (2006). Rural school districts and the fight for funding adequacy: The legal challenge of “CASFG v. State of Georgia”. Journal of Education Finance, 32(1), 71-88.
[13] McDaniel v. Thomas, 248 Ga. 632, 285 S.E.2d 156 (Ga. 1981).
[14] Ibid.
[15] Ibid. Doherty, B. A., & McKissick, J. C. (2002). An economic analysis of Georgia’s Black belt counties. Retrieved from https://athenaeum.libs.uga.edu/bitstream/handle/10724/18790/CR-02-06.pdf?sequence=1
[16] GBPI sent a survey to educators and school leaders in every school district in Georgia in the summer of 2019. The responses are used with permission.
[17] Based on a GBPI analysis of Educator Experience data from the Governor’s Office of Student Achievement.
[18] Based on a GBPI analysis of Out-of-Field Teachers data from the Governor’s Office of Student Achievement.
[19] See: Clotfelter, C. T., Ladd, H. F., & Vigdor, J. L. (2007). Teacher credentials and student achievement: Longitudinal analysis with student fixed effects. Economics of Education Review, 26(6), 673-682; Darling-Hammond, L. (2000). Teacher quality and student achievement. Education policy analysis archives, 8, 1.
[20] Klopfenstein, K. (2004). The advanced placement expansion of the 1990s: How did traditionally underserved students fare? Education policy analysis archives, 12, 68.
[21] Based on a GBPI analysis of FTE data, 2007 to 2018.
[22] Source: GBPI Analysis of Georgia Department of Community Affairs data. Phase I Unserved Georgia by County.
[23] Ibid.
[24] Based on a GBPI analysis of Directly Certified students and 3rd grade Milestone data.
[25] A score of 3 traditionally represents that a student is qualified to receive college credit for that course.
[26] Based on a GBPI analysis of Hope Eligible Graduates data.
[27] See: Baker, B. D. (2016). Does money matter in education?. Albert Shanker Institute. Retrieved from https://files.eric.ed.gov/fulltext/ED563793.pdf
[28] Vernez, G., Krop, R. A., & Rydell, C. P. (1999). Closing the Education Gap: Benefits and Costs. RAND, 1700 Main Street, PO Box 2138, Santa Monica, CA 90407-2138.
[29] Lynch, R. G., & Oakford, P. (2014). The Economic Benefits of Closing Educational Achievement Gaps: Promoting Growth and Strengthening the Nation by Improving the Educational Outcomes of Children of Color. Center for American Progress.[/vc_column_text][/vc_column_inner][vc_column_inner width=”1/2″][vc_column_text]
[30] Henderson, M. B., Houston, D., Peterson, P. E., & West, M. R. (2019). Public Support Grows for Higher Teacher Pay and Expanded School Choice. EducationNext. Retrieved from https://www.educationnext.org/school-choice-trump-era-results-2019-education-next-poll/
[31] McCosh, J. (2018). New Poll Shows Overwhelming Support for GBPI’s People-First Plan. Georgia Budget and Policy Institute. Retrieved from https://gbpi.org/2018/new-poll-shows-overwhelming-support-for-gbpi-people-first-plan/
[32] FundEd (2019). National Policy Maps. EdBuild. Retrieved from http://funded.edbuild.org/national#poverty
[33] McKillip, M. & Farrie, D. (2019). Replacing Georgia’s early intervention and remedial programs with funding for low-income students. Education Law Center. Retrieved from https://edlawcenter.org/research/funding-opportunity.html
[34] Baker, B. D., Farrie, D., & Sciarra, D. G. (2016). Mind the gap: 20 years of progress and retrenchment in school funding and achievement gaps. ETS Research Report Series, 2016(1), 1-37.
[35] Suggs, C. (2018). Tackle poverty’s effects to improve school performance. Georgia Budget and Policy Institute. Retrieved from https://cdn.gbpi.org/wp-content/uploads/2017/12/Tackle-Poverty-in-Schools.pdf
[36] See: Farmer, J., Knapp, D., & Benton, G. M. (2007). An elementary school environmental education field trip: Long-term effects on ecological and environmental knowledge and attitude development. The journal of environmental education, 38(3), 33-42.; DeWitt, J., & Storksdieck, M. (2008). A short review of school field trips: Key findings from the past and implications for the future. Visitor studies, 11(2), 181-197.
[37] Based on a GBPI analysis of tax digest data.
[38] Kreisman, D., & Steinberg, M. P. (2019). The effect of increased funding on student achievement: Evidence from Texas’s small district adjustment. Journal of Public Economics, 176, 118-141.
[39] Hart, B., & Risley, T. R. (2003). The early catastrophe: The 30 million word gap by age 3. American educator, 27(1), 4-9.
[40] Friedman-Krauss, A. H., Barnett, W. S., Garver, K. A., Hodges, K. S., Weisenfeld, G. G. & DiCrecchio, N. (2019). The State of Preschool 2018: State Preschool Yearbook. New Brunswick, NJ: National Institute for Early Education Research.
[41] Barnett, W. S., Jung, K., Friedman-Krauss, A., Frede, E. C., Nores, M., Hustedt, J. T., … & Daniel-Echols, M. (2018). State prekindergarten effects on early learning at kindergarten entry: An analysis of eight state programs. AERA Open, 4(2), 2332858418766291.
[42] Ibid. Based on 2018 dollars.
[43] Hannah-Jones, N. (2019). The 1619 Project. The New York Times. Retrieved from https://www.nytimes.com/interactive/2019/08/14/magazine/black-history-american-democracy.html
[44] Anderson, James. (1988). The Education of Blacks in the South, 1860 – 1935. The University of North Carolina Press, pg 6.
[45] National Center for Education Statistics. Number and percentage of public school students eligible for free or reduced-price lunch, by state: Selected years, 2000-01 through 2015-16. Retrieved from https://nces.ed.gov/programs/digest/d17/tables/dt17_204.10.asp
[46] Based on a GBPI analysis of student enrollment data.
[47] This concept is known as “horizontal equity.” See: Odden, A., & Picus, L. (2004). School finance: A policy perspective. Boston: McGraw-Hill, c2004.
[48] Known as “vertical equity.” See: Odden, A., & Picus, L. (2004). School finance: A policy perspective. Boston: McGraw-Hill, c2004.
[49] Rubenstein, R., Doering, D., & Gess, L. (2000). The equity of public education funding in Georgia, 1988-1996. Journal of Education Finance, 187-208.
[50] National Research Council. (1999). Equity and adequacy in education finance: Issues and perspectives. Washington, DC: The National Academies Press. https://doi.org/10.17226/6166.
[51] Governor’s Office of Student Achievement. Retrieved from https://gosa.georgia.gov/downloadable-data[/vc_column_text][/vc_column_inner][/vc_row_inner][/vc_column][/vc_row]