Completing a postsecondary program is more important than ever for a student’s future well-being and the state’s economic growth. But rising costs are combining with shrinking access to Georgia’s financial aid programs to push higher education out of reach for too many students, especially those from low-income families. Tuition skyrocketed in recent years, driven in part by deep cuts in state funding. Meanwhile, stagnant wages are making it hard for most students and their families to keep up. About 13,000 students were dropped by the university system from fall 2014 to fall 2015 alone because they could not pay tuition and fees.
The HOPE Scholarship and the HOPE Grant constitute Georgia’s primary strategy to provide financial aid to students in postsecondary education programs. Thousands of Georgia students have benefited from these programs since their creation in 1993, and many families continue to benefit today. But despite that track record of success, troubling gaps exist. This first-of-its-kind analysis of data from Georgia’s university and technical college systems shows:
Less than half of in-state students benefit from Georgia’s flagship merit-based aid programs, the HOPE and Zell Miller Scholarships. While the two scholarships benefit many, they only reach about 36 percent of students in the university system and 8 percent of students in associate degree programs in the technical college system. Reasons for the shortfall include poverty, which creates barriers to academic success from early childhood onward. An age restriction also prevents nontraditional students from accessing the program.
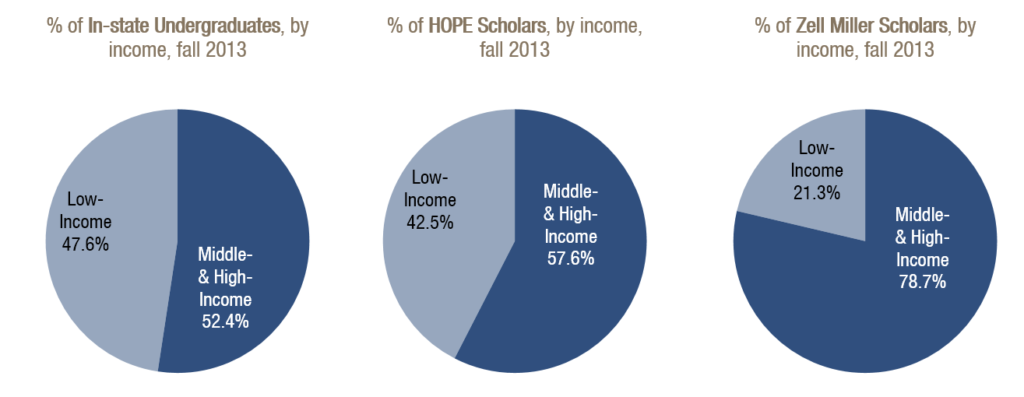
The merit-based scholarships are disproportionately out of reach for students of modest means. Only 30 percent of low-income students in the university system get either the HOPE or Zell Miller scholarships, compared to 42 percent of middle- and upper-income students. As a result, low-income students are underrepresented among scholarship recipients in the university system. Low-income students account for 43 percent of HOPE scholars and only 21 percent of Zell Miller scholars, while they are 48 percent of undergraduate enrollment.
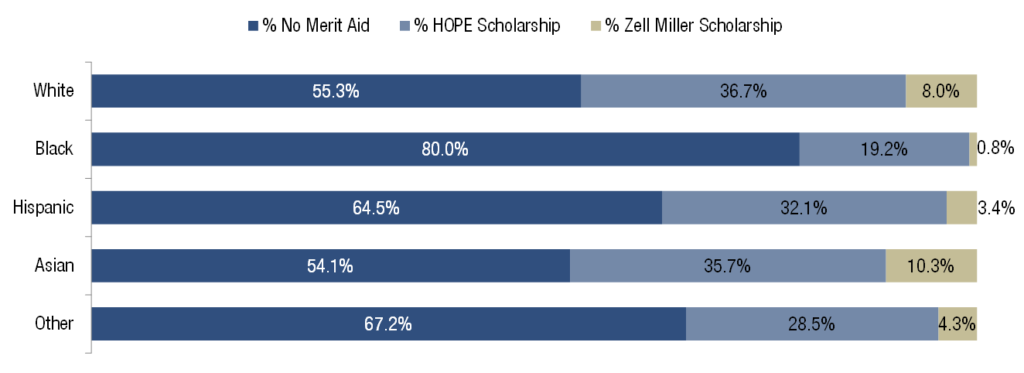
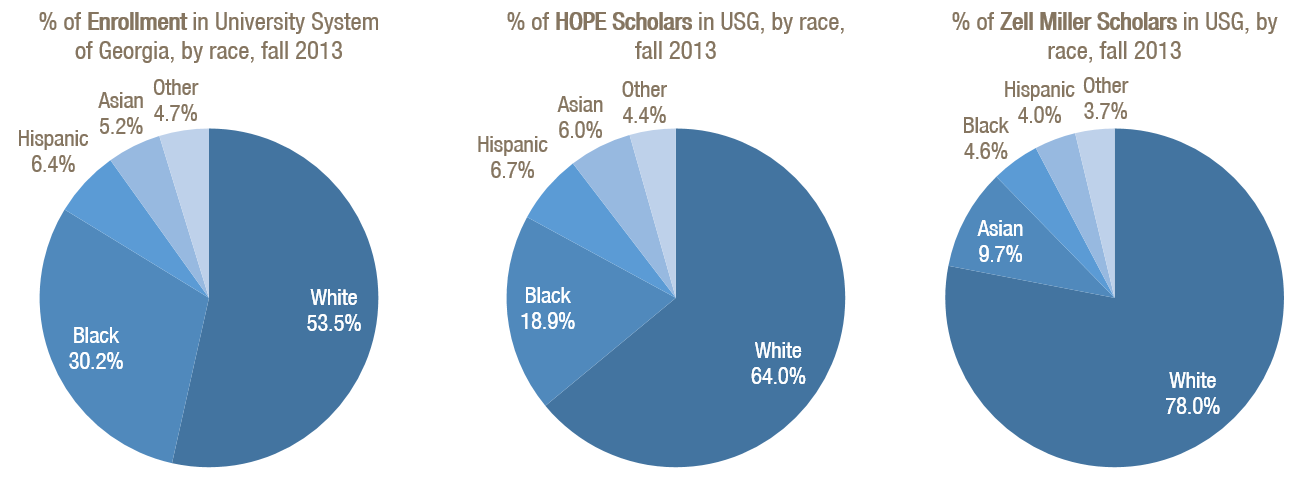
Students from historically marginalized groups are underrepresented among scholarship recipients. Within the university system, only about 20 percent of black students and 36 percent of Hispanic students get either the HOPE or Zell Miller scholarships, versus 46 percent of Asian American and 45 percent of white students. White students make up 64 percent of HOPE Scholars and 78 percent of Zell Miller Scholars, while they account for only 54 percent of undergraduate enrollment.
Georgia’s main aid program for technical college students, the HOPE Grant, does a good job reaching low-income students including minorities. But coverage isn’t universal and the program falls short of meeting students’ full financial needs. The HOPE Grant reaches about 74 percent of technical college students in certificate and diploma programs including 85 percent of low-income students. The majority of certificate and diploma students of any racial and ethnic background receive a HOPE Grant. About 75 percent of white students get a grant, 73 percent of black students, 70 percent of Hispanic students and 54 percent of Asian students.
The limited reach of Georgia’s financial aid portfolio is not sufficient to meet the state’s workforce development goals in today’s rapidly changing and fiercely competitive global economy. In a quickly diversifying state that also struggles with widespread poverty, students need more options to gain valued skills and enter successful careers, regardless of their families’ background or bank account.
Georgia can build on the success of the HOPE Scholarship and the HOPE Grant by finding ways to help more students from low- and middle-income families succeed in college and enter the workforce with valuable skills and knowledge. Promising policy options include restoring the HOPE Grant’s original full coverage of tuition and fees for technical college, eliminating an arbitrary age restriction for merit-based scholarships and establishing a new needs-based financial aid program available to all Georgia students. Whatever the precise path taken, Georgia needs an enhanced approach to financial aid to improve families’ financial security and the state’s ability to build a workforce that attracts and develops high-growth, high-wage industries.
Brief Notes on Data and Methods
To better understand students’ financial needs, the Georgia Budget and Policy Institute examined participation rates for the HOPE Scholarship, including the Zell Miller Scholarship. We also looked at HOPE Grant recipients. We reviewed data on scholarship and grant recipients provided by the University System of Georgia and the Technical College System of Georgia and other information from the university system.
We requested data on HOPE and Zell Miller Scholarship recipients and non-recipients from the University System of Georgia. The system provided non-personally identifiable data on all undergraduates in fall 2013. GBPI excluded out-of-state students from its analysis as well as in-state students identified as post-baccalaureate, audit or dual enrollment. GBPI also requested data on HOPE and Zell Miller Scholarship recipients, HOPE and Zell Miller Grant recipients and Strategic Industries Workforce Develop Grant recipients from the technical college system. The technical college system provided fall 2013 data. Out-of-state residents are not excluded due to data constraints but comprise less than 2 percent of all students in the system. Findings draw on these data unless noted.
Georgia’s Future Prosperity Depends on Access for All to Higher Education
Policy solutions that enable more students to gain the financial benefits of a college degree will help build the skilled workforce Georgia needs to attract competitive industries and foster economic growth. It will help make college more affordable for Georgia’s families and respond to ongoing demographic changes.
Higher Education Helps Students and Their Families Thrive
People with a postsecondary degree earn much more than those without one. Nationally the median weekly earnings of an individual with an associate’s degree were almost 18 percent higher than those of someone with a high school diploma in 2015.1 Earnings were 68 percent higher for those with a bachelor’s degree and almost 98 percent higher for those with a master’s degree. Postsecondary degrees also buffer the impact of economic downturns. While earnings declined for most bachelor and graduate degree holders during the Great Recession, the declines were smaller than for those without a degree.2
Unemployment rates are lower for people with a degree. The national unemployment rate for people with a high school diploma was 5.4 percent in 2015.3 It was 3.8 percent for individuals with an associate’s degree, 2.8 percent for those with a bachelor’s degree and 2.4 percent for those with a master’s degree. Even during the Great Recession, unemployment rates for degree holders were well below those with only a high school diploma.4
Widespread Access to Financial Aid Critical to Meeting State Workforce Goals
By 2020, 32 percent of all jobs in Georgia will require a bachelor’s degree or higher.5 Sixty percent of jobs overall will require some level of postsecondary education, ranging from certificate programs to university degrees.6 The state does not have enough people now with the education needed to fill all of these jobs. Georgia officials set a goal to increase the number of postsecondary school graduates by 250,000 by the year 2025. Through the Complete College Georgia Initiative, the university and technical college systems designed and implemented strategies to meet this goal including strengthening remediation, improving student advising and giving course credit for experiential learning.
But rising costs are hindering progress toward the Complete College Georgia goal. In fall 2014, 6,500 students were dropped by the university system for nonpayment of tuition and fees.7 University presidents helped keep about 3,000 other students in school by raising money to provide them with institutional need-based scholarships. In fall 2015 about 6,500 more students were dropped by the system because they could not afford to pay for classes.8 The money raised by individual institutions, which varies considerably in amount, is critical but cannot meet the scope of students’ financial needs across the system.
Total enrollment in the state’s technical colleges declined each year since 2010. It is now lower than in 2008. An improving economy with more job options is a likely factor but so is the declining value of the HOPE Grant and Scholarship awards.
Rising Costs Pushing Higher Education Out of Reach for Many
Tuition and fees rose steadily across the nation and in Georgia for years, in part due to steep cuts in state funding. Since 1990, state funding per student in Georgia fell 26 percent, adjusted for inflation.9 Meanwhile, family incomes barely budged.10 Tuition paid by students and families now covers about half of the cost of educating students in Georgia’s university system, up from about 25 percent in the 1990s.11 Paying for college is now a struggle for many students and their families, especially those at the lowest income levels.
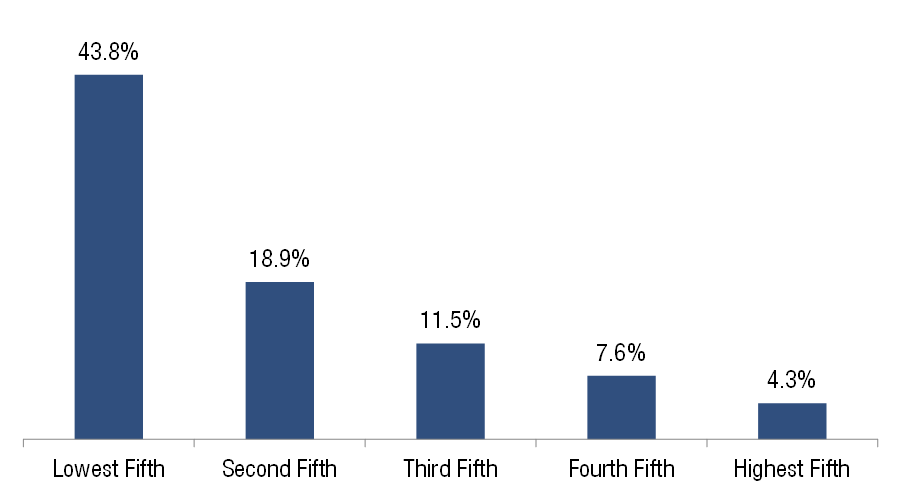
High Education Costs Hitting Lower-Income Families Hardest
Median Tuition & Fees at Public Four-Year Institutions as Percentage of Family Income
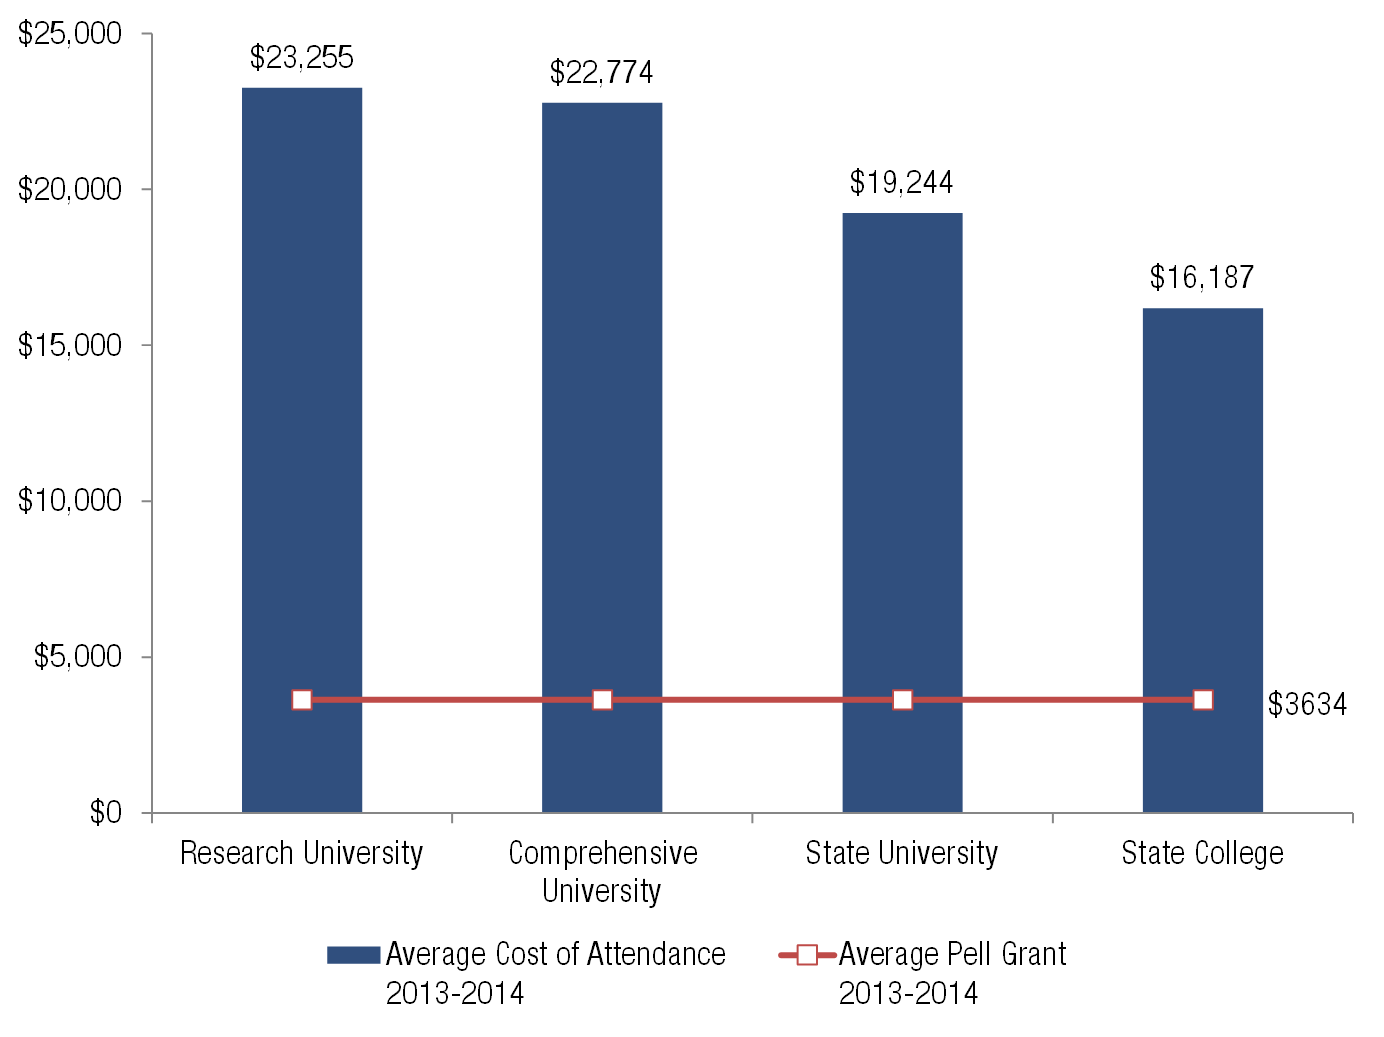
The burden is even higher when the full cost of attendance is factored in, including room and board, books, transportation and other associated expenses. Here is the average cost of attendance in the 2013-2014 academic year at the system’s four types of schools:
- $23,255 at research universities, 47 percent of median family income, or $49,555 in Georgia in 2014
- $22,774 at comprehensive universities, 46 percent of median family income
- $19,244 at state universities, 39 percent of median family income
- $16,187 at state colleges, 33 percent of median family income12,13
Students in the state’s technical colleges faced similar challenges. In 2013-2014 the total price for in-state technical college students living with family ranged from nearly $5,000 to about $11,000, depending on the institution. Those not living with family paid a steeper price, from about $9,000 to $19,000.14
Some students cover these costs with their own earnings, help from their families, grants and scholarships, subsidized student loans and federal financial aid, including Pell grants for low-income students. Many students still come up short, because Pell grants and subsidized loans do not go very far. Nationally the maximum Pell Grant award in the 2013-2014 school year was $5,645 and the average grant was $3,634.15 The average grant covered about 22 percent of the cost of attendance at Georgia’s state colleges and about 15 percent at its research universities.
Federal Grant for Low-Income Students Falls Well Short of Needs
Cost of Attendance Covered by Average Pell Grant
 At the same time, the maximum amount of a federally-subsidized loan for undergraduates is $5,500, enough to cover about 24 to 34 percent of the cost of attendance depending on the institution. About 97,000 students in the university system could not cover the full cost of going to college in Georgia in 2013-2014 even with scholarships, grants and a $5,500 subsidized loan.16 Their unmet need averaged $6,800. Many students borrow more by using unsubsidized loans, which have a higher price than subsidized loans. The federal government pays the interest on subsidized loans while students are in school and during a six-month grace period after graduation, but does not on unsubsidized loans.
The average student loan in the university system was $6,700 in 2013-2014, including both subsidized and unsubsidized loans.17 These loans add up over the course of a college career. Georgia students who graduated in 2013 with a bachelor’s degree owed an average of $23,000 to $25,000 depending on the school.18
Their parents borrowed too. They took out more than 24,000 Parent Loans for Undergraduate Students in Georgia in 2013-2014.19 The average parent loan amount that year was $14,916, nearly 30 percent higher than in 2008-2009 and above the national average.20
$6,700: Average loan amount for Georgia university students (2013-14)
$14,916: Average PLUS loan taken out by Georgia parents (2013-14)
$23,000-$25,000: Average student loan debt for Georgians upon earning bachelor’s degree, 2013
Many technical college students also struggled to cover costs. After including financial aid, students in the lowest income group with personal or family earnings of $30,000 or less paid between $1,409 and $9,076 to cover the full cost of attendance in 2013-2014.21
Students at 15 technical colleges face the additional barrier that their schools do not participate in the federal student loan program.22 Students can turn to higher cost private loans or credit cards, or they can work more or reduce course loads. Those choices increase the risk of non-completion. Too much debt is a problem for some students but no access to even a modest subsidized loan can be a hindrance as well.
Rising Costs Especially Problematic for Poorer, Increasingly Diverse Communities
Georgia’s student population grew poorer and more racially diverse in recent years, a trend likely to continue and that heightens the necessity of an enhanced approach to financial aid.
- About 27 percent of undergraduate students in the university system in fall 2006 received a Pell Grant.23 By fall 2014, that number rose to 44.5 percent.24,25
- Nearly 31 percent of technical college students received a Pell Grant in fall 2006, which soared to 59 percent in fall 2013.26
- This rise in low-income postsecondary students mirrors K-12 schools. Approximately 50 percent of K-12 students were from low-income families in the 2005-2006 school year, as measured by participation in the federal free and reduced lunch program.27 Sixty-two percent of K-12 students participate in the program in the 2015-2016 school year. These students will likely require financial aid if they are going to move on to and complete a postsecondary program.
The increase in low-income students is connected to the growing number of minority students, who experience higher poverty rates than white students. More than two-thirds of black students and more than half of Hispanic students receive a Pell Grant while less than a third of white students do. From fall 2006 to fall 2015, the proportion of black students in the university system rose from 23.7 percent to 27.6 percent.28 The portion of Hispanic students grew from 3 percent to 7.3 percent. The percentage of white students fell from more than 64 percent to nearly 52 percent.
Georgia Colleges Increasingly Diverse
Georgia’s Helping Outstanding Pupils Educationally financial aid program was created in 1992 by then-Gov. Zell Miller to increase the number of homegrown students who enrolled in and completed college. Georgia issued the first awards in the 1993-1994 school year. The HOPE Scholarship is open to students attending public or private institutions while the HOPE Grant is limited to students in public ones. The program is funded by the Georgia Lottery. It consists of six components:
- HOPE Scholarship
- Zell Miller Scholarship
- HOPE Grant
- Zell Miller Grant
- Strategic Industries Workforce Development Grant
- HOPE GED
The HOPE Scholarship and the Zell Miller Scholarship support students who are pursuing an associate or a bachelor’s degree. Both are awarded based on specific levels of academic achievement and are often referred to as merit aid. The grant programs assist students in certificate or diploma programs in technical colleges. This analysis focuses on two groups in fall 2013. One group is HOPE and Zell Miller scholarship recipients who attended an institution in the university or technical college systems. This analysis excludes students attending private institutions, or about 11 percent of HOPE scholars in fiscal year 2015. The other group is HOPE Grant recipients enrolled in the technical college system.
The HOPE Scholarship
Current eligibility criteria require students to be Georgia residents and graduate from high school with a 3.0 grade point average in core academic subjects. They must also take academically rigorous classes such as advanced math, advanced science, foreign languages, Advanced Placement, International Baccalaureate, or postsecondary classes beginning in 2015. Students who graduated from high school that year are required to take two of these classes. In 2016 they are required to take three. In 2017 and beyond they must take four. Students must maintain a 3.0 GPA in college to retain the scholarship. The scholarship is capped at 127 credit hours and does not cover remedial courses.
In addition eligibility is limited to students within the first seven years after high school graduation, with an exception for students who serve on active duty in the military. This requirement does not apply to students who received the scholarship prior to the 2011 summer term.
The scholarship award amount fluctuates for students at public institutions based on tuition and lottery revenues. It covered an average of 84 percent of tuition at university system institutions in the 2015-2016 school year.
The existing eligibility criteria are more stringent and the current award amount is lower than in the past. At first state officials limited the scholarship but by the mid-1990s it covered full tuition and mandatory fees for students at public universities and provided a book allowance. Lawmakers tweaked the rules over the years but then in 2011 made major revisions when costs rapidly outpaced revenues. Big changes included no more money for fees and books, adding the rigorous courses requirement and restricting eligibility to the first seven years after high school graduation. Lawmakers also created the Zell Miller Scholarship for the highest achieving students in 2011.
Some changes are still taking effect so their full impact is uncertain. Still, they raise the possibility that fewer students will be served by either scholarship in the future. For example, differences in the number and type of rigorous courses that districts and high schools offer may impact students’ access to these classes and subsequent success.
The Zell Miller Scholarship
The Zell Miller Scholarship covers full tuition and comes with tougher eligibility requirements than the HOPE Scholarship. Recipients must be Georgia residents who graduate from high school with a 3.7 GPA in core subjects. They are also required to complete the same number of academically rigorous courses as HOPE scholars. They must also achieve a minimum score of 1200 on the math and reading portions of the SAT exam or a composite score of 26 on the ACT exam. These requirements must be met when students graduate from high school. They must maintain a 3.3 GPA in college to retain the scholarship.
Students are eligible for the Zell Miller Scholarship for the seven years immediately following high school graduation unless they get credit for time spent on active duty military service.
The HOPE Grant
Students must be Georgia residents enrolled in a certificate or diploma program at an institution in the technical college or university systems to be eligible for a HOPE Grant. Entering students are not given a GPA standard to meet to receive a grant, but they are required to maintain a cumulative 2.0 GPA throughout their coursework to retain it.
The HOPE Grant covers a portion of tuition. For students in the technical college system, the grant now covers about 75 percent of tuition, a smaller portion than for HOPE Scholarship recipients.
Prior to the legislative reforms of 2011, the grant covered full tuition and mandatory fees and provided a book allowance. The General Assembly also increased the required GPA to 3.0 as part of their 2011 changes. Enrollment plunged after these changes. Full-time equivalent student enrollment in the technical college system fell nearly 25 percent between 2011 and 2012. Then-commissioner of the technical college system, Ron Jackson, reported 9,000 students lost the grant due to the higher GPA requirement and that many more students simply did not enroll because they could no longer afford it.29
In 2013 the General Assembly reset the required GPA to 2.0. It did not restore the award amount but did create a new type of targeted assistance, the Strategic Industries Workforce Development Grant. This program provides a supplemental grant to students in high-demand fields to cover the tuition shortfall. The program launched in the 2014 fiscal year focused on three vocations. It now covers 12 fields for the 2017 fiscal year. In its first year of operation, the program proposed that 7,212 students get the strategic grant with an average award amount of $503. In the 2015 fiscal year, the program proposed 13,703 students get a grant averaging $448.30
In 2014, the General Assembly approved the creation of the Zell Miller Grant, which covers full tuition for technical college students in certificate and diploma programs who maintain a 3.5 GPA. In fall 2014, the program’s first semester, 10,806 students received one.
Gaps in HOPE Coverage Reveal Need for Solutions
Thousands of Georgia students benefited from the creation of the HOPE Scholarship and HOPE Grant in 1993, and many families still do. Despite that track record of success, troubling gaps exist and that’s especially true for students from poorer backgrounds.
Many Georgians Struggle to Access HOPE Scholarship
The HOPE Scholarship provides merit-based aid to students pursuing a bachelor’s or associate degree in the university system or an associate degree in the technical college system. The scholarship differs sharply from the HOPE Grant, which aids students in diploma and certificate fields in the technical college system and is not based on merit.
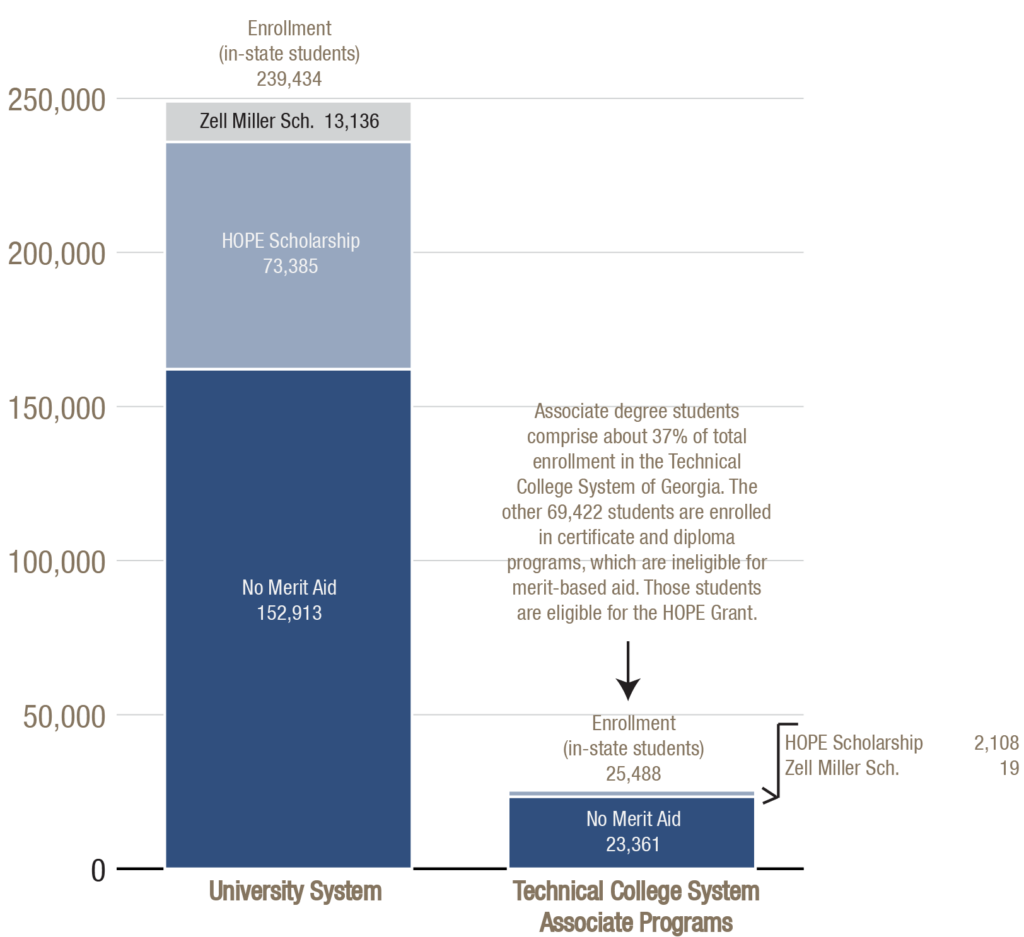
About 64 percent, or 152,913 of the 239,434 in-state, undergraduate students in the university system did not get merit aid in the 2013-2014 school year. Nearly 31 percent received the HOPE Scholarship and another 5.5 percent got the Zell Miller Scholarship, a subset of HOPE created in 2011 that rewards the highest-performing students in the state. In the technical college system, nearly 92 percent of students in associate degree programs do not get merit aid. About 8 percent received a HOPE Scholarship and less than 1 percent, or 19 of the 25,488 associate degree students in fall 2013, got a Zell Miller Scholarship.
Majority of Students Don’t Get Merit-based Aid
Receipt of HOPE and Zell Miller scholarships in USG and TCSG, fall 2013
The share of students who receive merit aid can vary substantially among institutions. At the University of Georgia, 79 percent of students receive either the HOPE or Zell Miller scholarships, compared to only 39 percent of students at Georgia State University. More details are available in Appendix A.
Low-Income Students Less Likely to Receive Merit-Based Aid
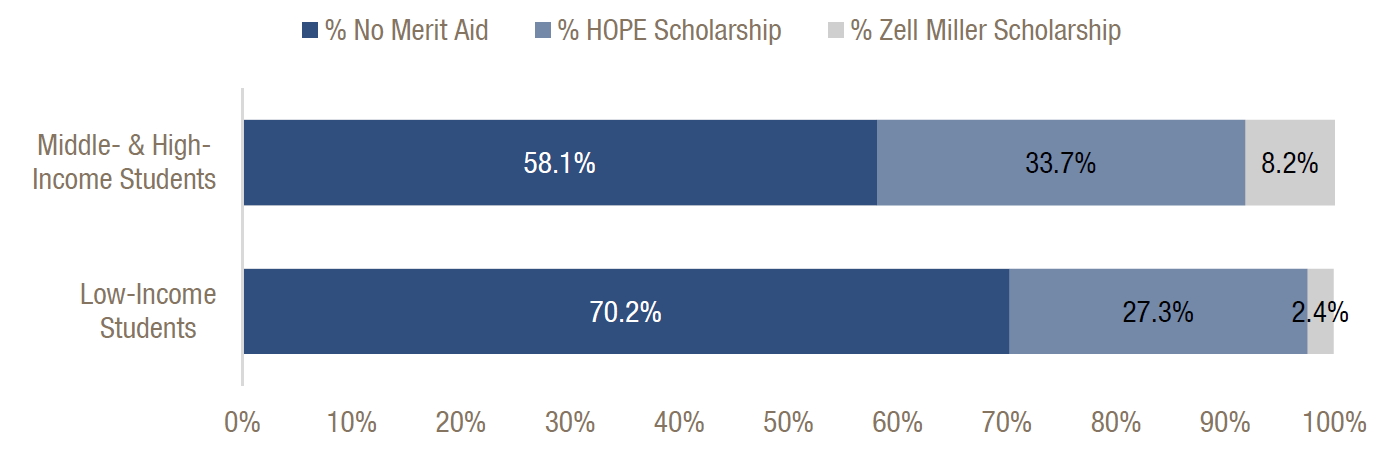
Close to half of students in the university system are low-income as measured by participation in the federal Pell Grant program, the standard indicator of poverty for postsecondary students.31 These low-income university students trail more affluent peers in receiving the HOPE or Zell Miller Scholarship, as shown in the following chart. Only about 30 percent of low-income university students receive aid through merit-based programs, compared to nearly 42 percent of middle- and high-income students. The disparity is especially large on the more exclusive Zell Miller Scholarship; three times as many non-poor students get the Zell Miller Scholarship as poor students.
Poor University Students Less Likely to Get Merit Aid than Non-Poor Students
Receipt of HOPE or Zell Miller scholarships in university system, by income, Fall 2013
 This gap is present when students enter the university system as freshmen and persists through their senior year. About 32 percent of low-income freshmen held one of the scholarships while 45.2 percent of non-poor freshmen did. Among seniors, 23.6 percent of low-income students had a merit scholarship while 35.3 percent of non-poor students did. Even when low-income students get a HOPE Scholarship, they can still struggle financially and drop out before finishing. About 61 percent of low-income HOPE scholars graduate from the university system within six years compared to about 75 percent of non-poor HOPE scholars.32
At the same time, low-income HOPE scholars in the university system are more vulnerable to losing the scholarship. Nearly 47 percent of low-income HOPE scholars lose their scholarship compared to about 39 percent of non-poor HOPE scholars.33 Losing HOPE has a greater effect on low-income students than their better-off peers. About 44 percent of these students graduated while 58 percent of non-poor HOPE scholars who also lost the scholarship completed their degrees.
The result is low-income students are underrepresented among scholarship recipients in the university system as a whole. Though they make up almost 48 percent of undergraduates, they comprise 42 percent of HOPE scholars and only 21 percent of Zell Miller scholars.
Low-Income University Students Under-Represented in Merit Aid Programs
Very few associate degree students in the technical college system get a HOPE or Zell Miller Scholarship, though poverty is less of a factor. About 8 percent of low-income associate degree students in the technical college system receive a HOPE Scholarship, which is nearly same rate as non-poor students who get one. Less than one percent of both low-income and non-poor students in technical colleges receive a Zell Miller Scholarship.
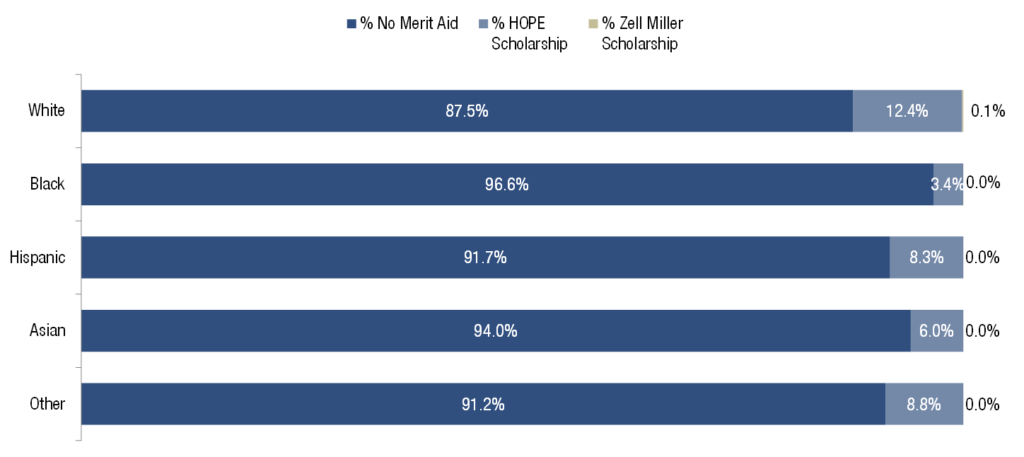
Race Stands as Out as a Contributing Factor in HOPE Scholarship Access
The proportion of students who receive a HOPE or Zell Miller Scholarship varies considerably by race across the university system. Black students are the least likely to receive either scholarship, while Asian-American and white students are the most likely. The greatest disparities are among Zell Miller Scholars. Within the university system, about 20 percent of black students, 36 percent of Hispanic, 46 percent of Asian American and 45 percent of white students receive either the HOPE or Zell Miller Scholarships.
Access to Merit Aid Varies by Race, Ethnicity
Receipt of HOPE or Zell Miller scholarships in the university system, by race, fall 2013
 Because students from historically marginalized communities are less likely to receive merit aid, they make up a disproportionately low share of HOPE and Zell Miller recipients in the university system. Black students make up 30.2 percent of university system undergraduates but only 18.9 percent of HOPE recipients. The gap is larger with the Zell Miller Scholarship where black students make up less than 5 percent of recipients. Hispanic students are also underrepresented among Zell Miller Scholars.
Proportion of HOPE and Zell Miller Scholars in the university system, by race, fall 2013
 Poverty is one reason for these disparities. Black students in particular experience much higher poverty rates than other groups, including extreme poverty. Poverty often creates significant hurdles to students’ academic success that begin early and persist. Young children who are poor trail their middle- and upper-income peers in language development and are less likely to participate in high quality child care. They are more likely to be exposed to environmental toxins that can cause health or developmental problems.34 As they progress through K-12 schools, they are more often taught by less experienced or less effective teachers than non-poor students.35,36 And increasingly low-income and minority K-12 students are isolated in schools that serve primarily only those students.37
Poverty Among Georgia’s University Students Varies by Race
Share of in-state undergraduate students receiving Pell Grant, by race, fall 2013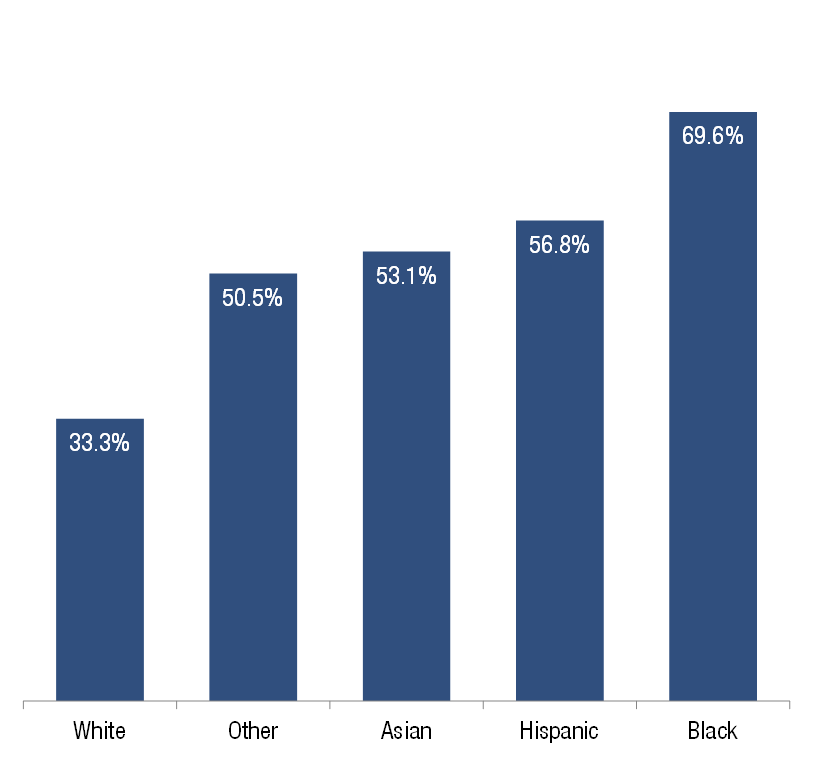
Far fewer students in the technical college system get the HOPE Scholarship at all, yet racial disparities persist among associate degree students as well. Students of color are less likely to receive either merit scholarship than white students, with only about 3.4 percent of black students in associate programs receiving the HOPE or Zell Miller Scholarship compared to 12.5 percent of white students.
Racial Gap Exists Among Few Associate Degree Students Who Get Merit Aid
Receipt of HOPE or Zell Miller scholarships in the technical college system, by race, fall 2013
 Minority students in associate degree programs are less likely to receive merit aid and they comprise a smaller share of merit recipients in the overall technical college system. The greatest gap is between black and white students. White students comprise 73.4 percent of HOPE and Zell Miller scholars in associate degree programs, despite accounting for only 49 percent of enrollment. In contrast, black students account for only 16.3 percent of HOPE and Zell Miller recipients compared to 40.2 percent of in-state undergraduate enrollment.38
Age Restriction Likely Limits HOPE Scholarship Access for Non-traditional Students
Students who delay going to college to work, take care of family or other reasons are hindered from getting merit aid by the seven-year time limit for high school graduates to use the HOPE and Zell Miller Scholarship. More than 12 percent of undergraduates in the university system in 2015, or 33,183 students, were 25 years old or older.39 Most will not be eligible for a scholarship.
The seven-year restriction plays a much larger role in limiting technical college students’ access to merit aid. About 60 percent of associate degree students are 24 or older, yet they comprise only 27 percent of HOPE Scholarship recipients and 5 percent of Zell Miller recipients in the technical college system. The most academically successful students out of high school for more than seven years cannot get either scholarship.
Merit Scholars: Representation by Age in the Technical College System
| Age | % Associate Degree Students in TCSG | % HOPE Scholarship Recipients in TCSG |
% Zell Miller Scholarship Recipients in TCSG |
| 23 and under | 40.2 | 72.7 | 94.7 |
| 24-34 | 33.4 | 17.3 | 5.3 |
| 35-44 | 15.4 | 6.1 | 0 |
| 45-54 | 8.6 | 2.8 | 0 |
| 55 and over | 2.5 | 1.1 | 0 |
HOPE Grant Provides Broad Coverage but Doesn’t Eliminate Cost Concerns
The numbers tell a different story for Georgia’s main aid program for technical college students, the HOPE Grant. A much higher proportion of students in certificate and diploma programs receive a HOPE Grant, and there are fewer disparities between students who receive one and those who do not.
HOPE Grant Covers Broad Swath of Technical College Students
TCSG enrollment, by degree program and receipt of HOPE Grant, fall 2013
 The HOPE Grant helps about 74 percent of the 69,422 technical college students in certificate and diploma programs. Technical college students who are in certificate and diploma programs are shown next to those in associate degree programs here for context. Associate degree students are eligible for the HOPE and Zell Miller scholarships but not the HOPE Grant.
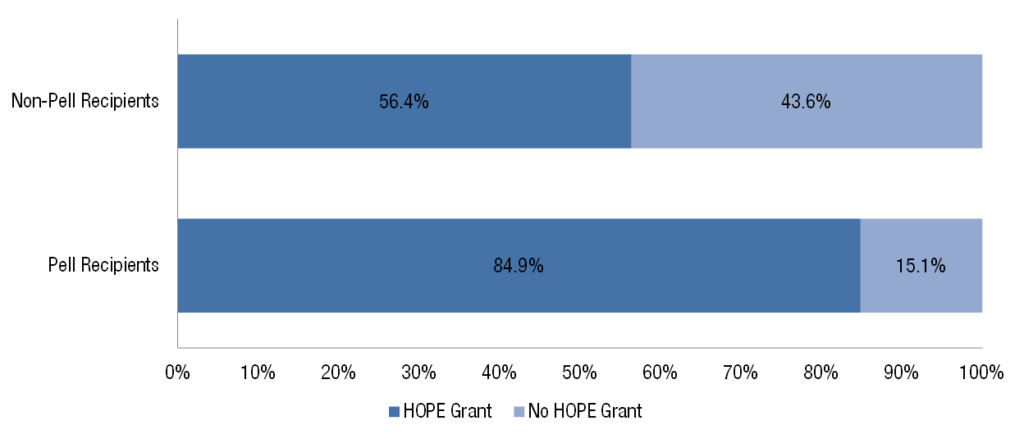
Grant Does Good Job Reaching Poor Students, Minorities
Poverty and race are much less a factor in a students’ access to the HOPE Grant. About 85 percent of low-income students get the grant, although 6,382 low-income students went without one. About 56 percent of non-poor students receive a grant.
Most Low-Income Students in Eligible Technical College Programs Get the HOPE Grant
Receipt of HOPE Grant by income, as measured by Pell Grant eligibility, fall 2013
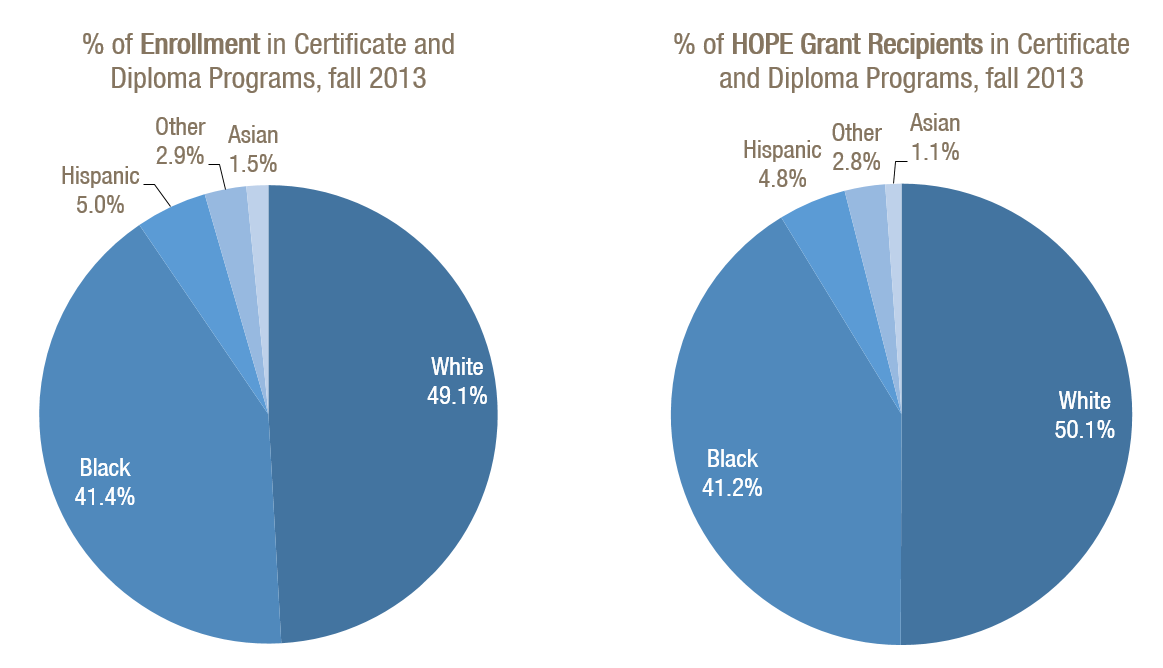
 Access to the HOPE Grant varies little among student populations. The racial or ethnic makeup of grant recipients closely mirrors the makeup of the overall technical system. White, black, and Hispanic students comprise nearly 96 percent of students enrolled in certificate and diploma programs, and similar majorities of each group receive the grant.
HOPE Grant Students Reflect Make-Up of Eligible Technical College Programs
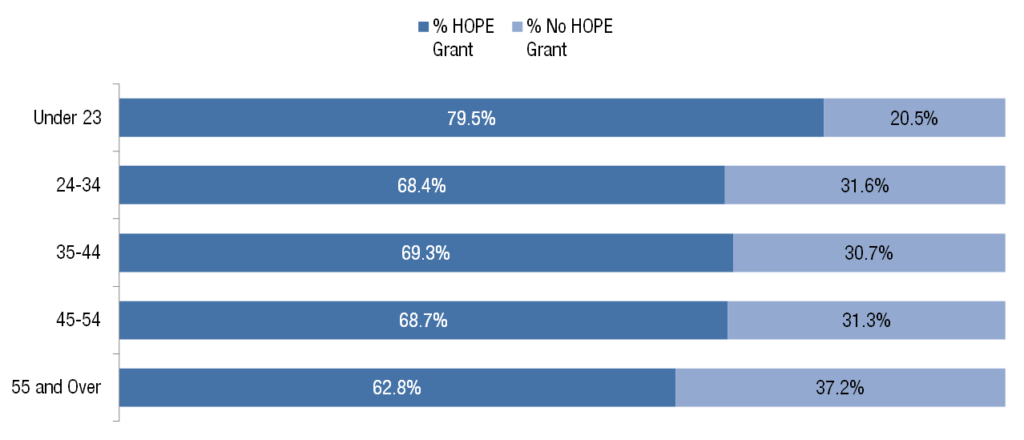
 Age Not a Major Factor in Access to HOPE Grant
The HOPE Grant does not carry a seven-year post-high school time limit so age is not a big factor as with the merit scholarships. More students under 23 get one than in older age groups but the majority of students in all age groups get one.
Age Plays Little Role in Which Students Get HOPE Grant
Receipt of HOPE Grant in certificate and diploma programs, by age, fall 2013
 Conclusion: Enhanced Approach to Financial Aid Can Strengthen Georgia’s Future
Georgia lawmakers changed the landscape of higher education when they created the HOPE Scholarship and the HOPE Grant more than 20 years ago. The programs boosted postsecondary enrollment and helped keep more of Georgia’s best prepared students in state for college. Georgia emerged as a national leader with its pioneering approach to keeping college costs within reach for many students. Other states followed its path. Georgia should take the lead again through an enhanced approach to financial aid that ensures students from all backgrounds, regardless of race, ethnicity, age or family income, can gain the benefits of a college degree.
This analysis concludes with three policy options that Georgia lawmakers can consider as first steps to remedy some of the inequities identified. This study is a launching point for additional GBPI research into these and other possible solutions.
Establish a new, stand-alone needs-based financial aid program. The HOPE and Zell Miller scholarships and the HOPE Grant provide a strong foundation for a broader approach to financial aid. One missing component is a set of strategies designed to help thousands of Georgia students struggling to keep up with rising costs. A program available to all students whether or not they also receive the HOPE Scholarship or HOPE Grant can provide a lifeline to hardworking families trying to juggle the high price of tuition, fees and cost of living.
A comprehensive strategy employed by Georgia State University provides strong evidence that needs-based aid can help keep students on track for graduation and is a worthy investment. Georgia State established Panther Retention Grants in 2011 as part of a broader effort to improve completion rates. The grants go to students at-risk for leaving school due to non-payment of tuition and fees. Seventy-one percent of seniors who received the grants graduated within two semesters and 90 percent of the freshmen who got them were retained.40 The grants are part of the reason Georgia State’s graduation rate climbed from 32 percent in 2003 to 54 percent in 2014.41
Institutional efforts like these make a difference but fall short of the full scope of students’ unmet financial needs. Students’ unmet need totaled about $660 million across the university system in the 2013-2014 academic year.42 That year institutions across the system raised only enough money to award $28.8 million in need-based aid.43
A comprehensive, statewide need-based aid program holds the potential to replicate the success of initiatives like those at Georgia State. Georgia now runs two aid programs that take need into account, but they serve only a small fraction of students (detailed in Appendix B).
$660 Million: Unmet student financial need across university system (2013-14)
$28.8 Million: Amount university system raised to award in need-based aid
Evidence shows need-based aid programs increase enrollment and support improved completion rates.44 If the university system’s graduation rate rose by 10 percentage points, approximately half Georgia State’s increase, about 5,200 more of the freshmen who enrolled in fall 2015 would graduate within six years.45,46 Even if the graduation rate rose by only five percentage points, Georgia’s colleges and universities would produce more than 2,600 additional graduates.
Restore the HOPE Grant to its original promise of full tuition plus fees for technical college. The reduction of the HOPE Grant award amount combined with tuition increases is making technical colleges less affordable. This is a likely factor in ongoing enrollment decline in Georgia’s technical colleges since its peak in 2010. The drop in credit hours students take is another indicator of the toll of diminishing affordability. More students enrolled in technical colleges in fall 2015 than in fall 2007 but they took far fewer credit hours. Taking fewer classes and lengthening the time they spend in school puts students at greater risk for not finishing. And Georgia’s employers depend on a steady contribution from the workforce development pipeline.
The Strategic Industries Workforce Development Grant supplements the HOPE Grant for students in selected fields as does the Zell Miller Grant and both are a valuable resources. But they serve only a portion of technical and diploma students. They also do not cover mandatory fees, which can be as costly as a class. A restored HOPE Grant will accelerate students’ pathway into the workforce.
Eliminate the HOPE Scholarship’s arbitrary penalty for students out of high school more than seven years. This regulation overlooks the growing number of students in their 20s, 30s and older who are enrolling in postsecondary programs. It is also at odds with a joint initiative by the university and technical college systems, Go Back, Move Ahead, to encourage people who dropped out of college to return and finish their programs. If they enroll in a certificate or diploma program, they can access a HOPE Grant. If their goal is an associate or bachelor degree, there is no state aid for them. Extending eligibility beyond seven years after high school gives academically successful college students of all ages a chance to participate in the HOPE Scholarship.
Appendix A: Distribution of Merit Aid by Institution
| Institution | % Pell | % HOPE Scholarship | % Zell Miller Scholarship | % HOPE & Zell Miller Scholarship | % No Merit Aid | Type |
|---|---|---|---|---|---|---|
| Georgia Institute of Technology | 24.3 | 29 | 34.8 | 63.8 | 36.2 | Research University |
| Georgia Regents University (now Augusta University) | 46.7 | 26.5 | 3 | 29.5 | 70.5 | Research University |
| Georgia State University | 54 | 37.1 | 1.8 | 38.9 | 61.1 | Research University |
| University of Georgia | 25.9 | 51 | 27.6 | 78.6 | 21.4 | Research University |
| Georgia Southern University | 41.3 | 39 | 3.5 | 42.5 | 57.5 | Comprehensive Universities |
| Kennesaw State University | 42 | 32.9 | 2.1 | 35 | 65 | Comprehensive Universities |
| University of West Georgia | 51.8 | 33.7 | 1.9 | 35.6 | 64.4 | Comprehensive Universities |
| Valdosta State University | 48.6 | 34.7 | 2.2 | 36.9 | 63.1 | Comprehensive Universities |
| Albany State University | 73.8 | 16.3 | 0.1 | 16.4 | 83.6 | State Universities |
| Armstrong State University | 47 | 28.3 | 2.3 | 30.6 | 69.4 | State Universities |
| Clayton State University | 62.6 | 14.2 | 0.4 | 14.6 | 85.4 | State Universities |
| Columbus State University | 50 | 33.5 | 2 | 35.5 | 64.5 | State Universities |
| Fort Valley State University | 78.4 | 14.4 | 0.4 | 14.8 | 85.2 | State Universities |
| Georgia College & State University | 22.3 | 60.2 | 6.8 | 67 | 33 | State Universities |
| Georgia Southwestern University | 49.9 | 23.6 | 1.9 | 25.5 | 74.5 | State Universities |
| Middle Georgia State University | 53.5 | 20.7 | 0.8 | 21.5 | 78.5 | State Universities |
| Savannah State University | 78.6 | 18 | 0.3 | 18.3 | 81.7 | State Universities |
| University of North Georgia | 38.7 | 36.3 | 3.2 | 39.5 | 60.5 | State Universities |
| Abraham Baldwin Agricultural College | 50.3 | 31.1 | 1.9 | 33 | 67 | State Colleges |
| Atlanta Metropolitan College | 77.6 | 3.3 | 0 | 3.3 | 96.7 | State Colleges |
| Bainbridge State College | 80.9 | 32.2 | 0.3 | 32.5 | 67.5 | State Colleges |
| College of Coastal Georgia | 57 | 23 | 0.8 | 23.8 | 76.3 | State Colleges |
| Dalton State University | 59.8 | 37 | 1 | 38 | 62 | State Colleges |
| Darton State College | 59.5 | 14.6 | 0.6 | 15.2 | 84.9 | State Colleges |
| East Georgia State College | 64.9 | 18.3 | 0.5 | 18.8 | 81.2 | State Colleges |
| Georgia Gwinnett College | 53.4 | 20.7 | 0.5 | 21.2 | 78.8 | State Colleges |
| Georgia Highlands College | 51.8 | 18.8 | 0.3 | 19.1 | 80.9 | State Colleges |
| Georgia Perimeter College | 51.2 | 8.9 | 0.2 | 9.1 | 90.9 | State Colleges |
| Gordon State College | 57 | 21.8 | 0.7 | 22.5 | 77.6 | State Colleges |
| South Georgia State College | 66.9 | 24.8 | 1.2 | 26 | 74 | State Colleges |
| TOTAL | 47.6 | 30.6 | 5.5 | 36.1 | 63.9 | TOTAL |
Appendix B: Georgia’s Existing Need-Based Aid Programs: Help for Too Few Students
Georgia has two financial aid programs that target low-income students: the REACH Scholarship and the Student Access Loan program. Both provide valuable assistance to financially-needy students but their small size leaves thousands of low-income students without access to state aid.
REACH Scholarship. The Realizing Educational Achievement Can Happen Scholarship was established in 2012 and is a collaborative effort between the Georgia Student Finance Commission, school districts, and the private sector. To be eligible, students must qualify for the federal free and reduced lunch program, show academic promise, and have a record of good attendance and behavior. Preference is given to students who will be in the first generation in their families to attend a postsecondary institution. Students enter the program in eighth grade.
Students receive an annual scholarship of $2,500 for four years to help cover the cost of attending a college or university. They also meet regularly with a mentor and an academic coach throughout high school. To retain the scholarship, they must maintain a 2.5 GPA in core subjects and good attendance and discipline records in middle and high school as well as a 2.0 GPA in college.
The state covers the full cost of each district’s first cohort of REACH Scholars. Districts must raise a portion of the scholarship cost for subsequent cohorts. The amount is based on the relative wealth of a county as measured by unemployment rate, per capita income and percent of residents in poverty. The state covers the rest of the cost.
The number of scholarship recipients is capped at eight per graduating class for school districts with five or more high schools and five per graduating class for districts with four or fewer high schools. Thirty-three of the state’s 180 school districts participate in the 2015-2016 school year. The GSFC plans to add up to 41 additional districts in 2016-2017.
Student Access Loan Program. The $27 million SAL program provides low-interest loans to students who have exhausted all forms of federal financial aid but still have unmet need. Students are eligible if they are enrolled in an associate, bachelor or first-professional degree program in the university system or eligible private institution. Students enrolled in a certificate, diploma or associate degree program in the technical college system are also eligible. They must maintain satisfactory academic progress. HOPE and Zell Miller Scholarship recipients are given priority consideration. Remaining applicants are randomly selected.
The maximum loan amount for degree-seeking students is $4,000 per semester and $8,000 annually. Students may receive a loan multiple years. Loans are capped at $1,500 per semester and $3,000 annually for technical college students. The interest rate is one percent while students are in school and stays at that level for those who complete their programs in the designated amount of time. The rate increases to six percent for students who go past the designated time and rises to eight percent for those who graduate a year or more beyond.
Loans are cancellable for students who teach in science, technology, engineering or mathematics or work in public service. Loan repayment is waived for technical college students who graduate with a 3.5 GPA.
Over 3,900 students received loans averaging $6,874 in fiscal year 2015. In total 13,265 students got loans since fiscal year 2012 when the program was launched.
ENDNOTES
1 Bureau of Labor Statistics, U. S. Department of Labor. Earnings and unemployment rate by educational attainment. February 12, 2016. Retrieved September 6, 2016, 2016 from http://www.bls.gov/emp/ep_chart_001.htm.
2 Carnevale, A. P. and Cheah, B. (2015) From hard times to better times. Washington, DC: Center on Education and the Workforce. Retrieved March 9, 2016 from https://cew.georgetown.edu/wp-content/uploads/HardTimes2015-Report.pdf.
3 Bureau of Labor Statistics, U. S. Department of Labor. Earnings and unemployment rate by educational attainment. February 12, 2016. Retrieved September 6, 2016, 2016 from http://www.bls.gov/emp/ep_chart_001.htm
4 Carnevale, A. P. and Cheah, B. (2015) From hard times to better times. Washington, DC: Center on Education and the Workforce. Retrieved March 9, 2016 from https://cew.georgetown.edu/wp-content/uploads/HardTimes2015-Report.pdf.
5 Carnevale, A. P., Smith, N. & Strohl, J. (2013) Recovery: job growth and education requirements through 2020, state report. Washington, DC: Center on Education and the Workforce. Retrieved March 9, 2016 from https://cew.georgetown.edu/wp-content/uploads/StateProjections_6.1.15_agc_v2.pdf.
6 University System of Georgia. Complete College Georgia: Georgia’s Higher Education Completion Plan 2012. November 2011. Retrieved July 25, 2016 from http://www.usg.edu/assets/educational_access/documents/GaHigherEducationCompletionPlan2012.pdf .
7 University System of Georgia. College affordability and completion in the University System of Georgia: presentation to the Board of Regents. August 12, 2015
8 Email from University System of Georgia, August 24, 2016.
9 GBPI calculations with data from: State Higher Education Executive Officers Association. (2015). State higher education finance FY 2014, State by State Wave Chart. Retrieved April 3, 2016 from http://www.sheeo.org/resources/publications/shef-%E2%80%94-state-higher-education-finance-fy14.
10 U. S. Census Bureau. Table H-8: Median household incomes by state: 984 to 2014. Retrieved March 11, 2016 from https://www.census.gov/hhes/www/income/data/statemedian/
11 University System of Georgia. (2011) Funding Formula Overview. Retrieved from http://www.usg.edu/fiscal_affairs/documents/Consolidated_Formula_Presentation_-November_Board-_Final.pdf.
12 University System of Georgia. College affordability and completion in the university system of Georgia: presentation to the Board of Regents. August 12, 2015
13 U.S. Census Bureau. Table 8: Median Household Income by State-Single Year Estimates, 1984-2014. Retrieved March 30, 2015 from https://www.census.gov/hhes/www/income/data/statemedian/index.html
14 U.S. Department of Education, Integrated Postsecondary Data System. Georgia Public Two Year and Less Than Two Year Institutions, Total Price for in-state students living on campus with family and not with family. Retrieved July 11, 2016 from: http://nces.ed.gov/ipeds/
15 U.S. Department of Education. (2015) 2013-2014 Federal Pell grant program end of year report, Table 20. Washington, DC: Retrieved March 29, 2015 from http://www2.ed.gov/finaid/prof/resources/data/pell-2013-14/pell-eoy-2013-14.html.
16 University System of Georgia. College affordability and completion in the University System of Georgia: presentation to the Board of Regents. August 12, 2015
17 University System of Georgia. College affordability and completion in the University System of Georgia: presentation to the Board of Regents. August 12, 2015
18 University System of Georgia. College affordability and completion in the University System of Georgia: presentation to the Board of Regents. August 12, 2015
19 GBPI calculations based on data from the U.S. Department of Education. Title IV Program Volume Reports Direct Loan Program 2013-2014 Award Year Summary. Retrieved April 12, 2016 from https://studentaid.ed.gov/sa/about/data-center/student/title-iv .
20 Southern Regional Education Board. (2015) Table 68: Federal student loan programs, Fact book on higher education. Atlanta, GA: Author. Retrieved March 11, 2016 from http://publications.sreb.org/2015/2015_Fact_Book_webversion.pdf.
21 U.S. Department of Education, Integrated Postsecondary Data System IPEDS Net Price Data, Georgia Public Two-Year and Less-Than-Two-Year Institutions. Retrieved July 10, 2016. University System of Georgia institutions were excluded.
22 The Institute for College Access & Success. (2016) Community college enrollment and federal loan program participation status. Retrieved July 27, 2016 from http://ticas.org/sites/default/files/pdf/cc_participation_status_2015-16.pdf .
23 University System of Georgia. Pell grant recipients, fall 2006. Retrieved September 6, 2016 from http://www.usg.edu/assets/research/documents/finaid/pell_ftf_fall_06.pdf
24 University System of Georgia. Pell grant recipients, fall 2014. Retrieved March 12, 2016 from http://www.usg.edu/research/documents/finaid/srpt9119_SER_Fall2014.pdf.
25 Eligibility criteria for the Pell grant program was expanded in 2007 and 2008. These changes contributed to the increase in the number of Pell-eligible students. However, some of these changes were subsequently rolled back, restricting the number of Pell-eligible students. (New America Foundation. Pell Grant Program Overview. May 2015. Retrieved July 27, 2016 from: http://atlas.newamerica.org/federal-pell-grant-program#toc-enrollment-growth-and-eligibility-changes-amidst-budget-pressures .)
26 Technical College System of Georgia. Fall 2006 Enrollment Report. Retrieved July 7, 2016 from https://kms.tcsg.edu/DPR/ReportsResearch/SystemSum.aspx.
27 Georgia Department of Education. Free and reduced price meal eligibility. October 4, 2005 & October 6, 2015, All Districts. Retrieved March 12, 2016 from https://app3.doe.k12.ga.us/ows-bin/owa/fte_pack_frl001_public.entry_form.
28 University System of Georgia. Semester Enrollment Reports, Fall 2015 and Fall 2006. Retrieved March 11, 2016 from http://www.usg.edu/research/enrollment_reports/semester_enrollment_reports.
29 Bluestein, G & Diamond, L. Deal proposes HOPE changes for technical colleges, Atlanta Journal Constitution. February 7, 2013. Retrieved July 6, 2016 from http://www.ajc.com/news/news/state-regional-govt-politics/deal-proposes-more-hope-changes/nWJGz/.
30 Office of Planning and Budget, State of Georgia. (2016). Zero based budget reports fiscal year 2017. Retrieved July 27, 2106 from http://opb.georgia.gov/sites/opb.georgia.gov/files/related_files/site_page/FY%202017%20ZBB%20Report.Final_.pdf.
31 Nationally 57 percent of Pell recipients had incomes less than $20,000 in the 2013-2014 school year and an additional 27 percent had incomes between $20,000 and $40,000. U.S. Department of Education. (2015) 2013-2014 Federal Pell grant program end of year report, Table 3A. Washington, DC: Retrieved March 31, 2015 from http://www2.ed.gov/finaid/prof/resources/data/pell-2013-14/pell-eoy-2013-14.html.
32 University System of Georgia. College affordability and completion in the University System of Georgia: presentation to the Board of Regents. August 12, 2015
33 University System of Georgia. College affordability and completion in the University System of Georgia: presentation to the Board of Regents. August 12, 2015
34 Coley, R. & Baker, B. (2013) Poverty and education: finding the way forward. Princeton, NJ: Educational Testing Service. Retrieved July 27,2016 from https://www.ets.org/s/research/pdf/poverty_and_education_report.pdf .
35 Strategic Data Project. SDP Human Capitol Diagnostic: Gwinnett County Public Schools, Georgia. May 2012. Center for Education Policy Research, Harvard University. Retrieved July 27, 2016 from http://sdp.cepr.harvard.edu/files/cepr-sdp/files/sdp-gcps-hc.pdf.
36 DeMonte, J. & Hanna, R. (2014) Looking at the best teachers and who they teach. Washington, DC: Center for American Progress. Retrieved July 27,2016 from https://cdn.americanprogress.org/wp-content/uploads/2014/04/TeacherDistributionBrief1.pdf.
37 U. S. Government Accountability Office. (2016) K-12 education: better use of information could help agencies identify disparities and address racial discrimination. Retrieved July 27, 2016 from: http://www.gao.gov/assets/680/676745.pdf
38 African-Americans make up 40 percent of all associate degree students but only about 16 percent of HOPE Scholarship recipients and 10 percent of Zell Miller Scholarship recipients. White students, in contrast, comprise 49 percent of associate degree students but 73 percent of HOPE Scholarship and 89.5 percent of Zell Miller recipients.
39 University System of Georgia. Semester Enrollment Report, Fall 2015. Retrieved July 7, 2016 from http://www.usg.edu/assets/research/documents/enrollment_reports/SER_Fall_2015.pdf.
40 University System of Georgia. College affordability and completion in the University System of Georgia: presentation to the Board of Regents. August 12, 2015.
41 Kurzweil, M and Wu, D. D. (2015) Building a pathway to student success at Georgia State University. New York: Ithaka S&R. Retrieved March 14, 2016 from http://www.sr.ithaka.org/wp-content/uploads/2015/08/SR_Case_Study_Building_Pathway_Student_Success_042315_0.pdf.
42 University System of Georgia. College affordability and completion in the university system of Georgia: presentation to the Board of Regents. August 12, 2015
43 University System of Georgia. College affordability and completion in the University System of Georgia: presentation to the Board of Regents. August 12, 2015.
44 Dynarski, S. (2003) Does aid matter: measuring the effect of student aid on college attendance and completion, The American Economic Review, 93 (1) 279-288.
45 University System of Georgia. Graduation Rate Report, Bachelor Degree Six Year Rates First Time Freshmen Fall 2009 Cohort. Available at http://www.info.usg.edu/
46 University System of Georgia. Fall Headcount Enrollment, Fall 2011-Fall 2015, First-Time Freshmen. Available at http://www.info.usg.edu/


