Updated Oct. 27, 2016
Schools Likely Worse Off With New Funding Formula
Strong public schools are essential in preparing young students for postsecondary study and life. They also prepare students for the demands of a competitive job market and to be active in the civic life of their communities. A central component of strong schools is adequate resources. Gov. Nathan Deal’s Education Reform Commission (ERC) proposes a new formula to fund public schools that offers flexibility but still falls short in several key areas.
Georgia’s students and communities will be saddled with those shortcomings if the 2017 General Assembly adopts the new model unchanged. The proposed formula will likely lead to less state funding in the future for districts statewide than a fully funded version of the current system, leaving schools without enough resources to provide a quality education. It also falls short of what is needed to provide a good education to low-income students and students in predominantly rural communities with above-average transportation costs. These challenges are linked to gaps in the new formula which lawmakers can correct by making four specific changes before passing the proposal into law:
- Add an adjustment for inflation to account for rising costs. The proposed formula lacks an inflation adjustment and eliminates the current annual adjustment for teachers’ salaries. These could lock in today’s funding levels and squeeze district budgets.
- Increase funding for students, schools and districts with greater needs. The supplemental funding allotted to economically disadvantaged students under the proposed formula is too low: just $232 a year or $1.29 per day over the 180-day school year. This amount should be increased to $600, the amount calculated if the formula used the average weight nationally for these students. A High-Needs Grant program should also be established to enable schools and districts with high concentrations of economically disadvantaged students and those learning English to provide the scope of services that best foster their academic success.
- Broaden the criteria to identify economically disadvantaged students. The proposal changes the way low-income students are identified, which cuts by nearly half the number of children who meet the definition.
- Continue to fund student transportation as a separate grant program that accounts for the wide variation in districts’ costs. The proposal ends the grant program and shifts transportation dollars into the per student base amount, which puts many rural districts and others with high transportation costs at a disadvantage. The state also underfunds transportation and eliminating the existing transportation program will lock that shortfall in place.
An overarching concern about the proposed formula is that it is not based on an objective, evidence-based assessment of the funding needed to provide a quality education to all of Georgia’s students. The reform commission tied future funding levels to one set by the existing 31-year-old Quality Basic Education (QBE) formula. This does not take into account Georgia’s rapidly changing student population nor the much higher performance standards in place today.
Flexibility in state funding can be a valuable lever for reform, but only when it’s paired with sufficient money to meet both growing needs and correct persistent problems. Georgia spends $1,800 less on each student than the national average, which leaves it 38th in per-student spending, according to the most recent federal data.[1] Georgia also ranks as a relatively low spender on public education in analyses that account for geographic cost differences.[2],[3] Increased funding is linked to better outcomes for students, particularly those from low-income families.[4] A new formula must ensure Georgia’s students get the resources they need to succeed in school.
The following sections provide more detailed information about:
- Gaps in the Proposed Formula
- The Education Reform Commission
- The Reform Commission’s Proposed Funding Formula
- Key Components of the Reform Commission’s Formula
- Recommendations
School Funding in Georgia Today
The cost of educating Georgia’s students is shared primarily by the state and local school districts. There are two main sources of state funds, the amount calculated by the QBE formula and Equalization Grants, and the so-called “Local 5 Mill Share” contributed by districts.
The largest source of state money for school districts is calculated by the QBE formula. In the 2017 fiscal year, the state is set to distribute $8.1 billion to districts through the formula. The equalization program provides about $499 million in grants to districts with low-property wealth and limited ability to raise local revenue for the year.
Districts contribute a smaller share as a minority funding partner by design.[5] They are required to contribute an amount equal to five mills of property tax levied on their property tax base, which is a cumulative $1.7 billion for the 2017 fiscal year. They routinely contribute much more. Districts invested $6.1 billion in local revenue in the 2015 fiscal year, the most recent available.
The federal government contributes a small percentage of school costs, about 7.3 percent of total funding in the 2015 fiscal year.
Gaps in the Proposed Formula
Omitting Inflation Adjustment Will Lock in Inadequate Funding Levels Indefinitely
The commission’s funding formula lacks an inflation adjustment. Today’s QBE formula is also missing an inflation factor, though this is in part offset by state funding that compensates teachers for years of experience and graduate degrees. State funding for teachers’ salaries in today’s formula goes up annually based on these factors.[6] The proposed formula eliminates this salary adjustment and provides a flat salary amount, which the Legislature will update at its discretion. It contains no other adjustment to keep pace with rising costs.
The lack of an inflation adjustment is different from the state’s approach to transportation funding, another investment vital to Georgia’s economic health. In 2015 the Legislature passed a comprehensive revenue package to increase the state’s transportation spending and make critical improvements to its roads and bridges. To ensure that the new revenues keep pace with rising costs, tax collections are adjusted by the Consumer Price Index for several years and in future years to account for rising fuel efficiency.
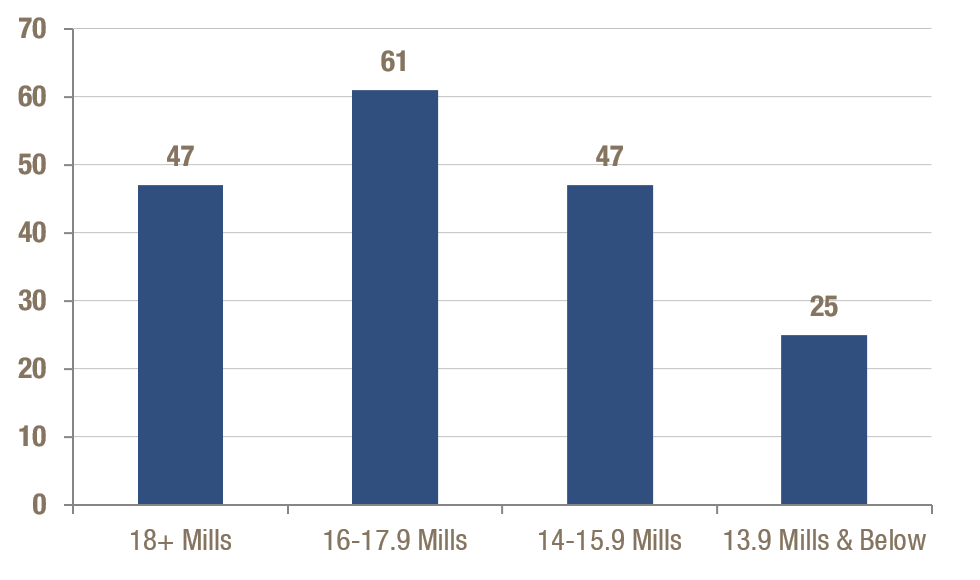
The nominal value of the money the state provides to school districts will erode in time without an inflation adjustment. This will push districts to increase local revenues, although that might not be an option for those at or near the 20 mills rate cap. Districts are required to contribute the amount equivalent to five mills of property tax to receive state funding through today’s formula. However most districts already invest much more than the value of five mills or even the 12.5 mills required to receive an equalization grant in the 2017 fiscal year. Many are at or close to the state’s 20 mills cap.[7] In 2015, 155 districts of Georgia’s 180 districts had millage rates of 14 or higher, the rate required to receive equalization funding as of July 1, 2019.
Chart 1: Most Districts Above Required Millage Rates in 2015
 Recommended Funding Level Doesn’t Meet Low-Income Students’ Needs
Economically disadvantaged students often face hurdles to learning and need extra support to overcome them. Their numbers are growing. In 2002 about 45 percent of Georgia’s K-12 students participated in the federal free- and reduced-price lunch program. That number reached 62 percent in 2016, one of the highest in the nation.
The Formula recognizes the added challenges these students often confront by allotting a supplemental amount to them. But the extra amount is low: $232.23 or $1.29 more per day for a 180-day school calendar. Chances are that is insufficient to pay for ways to improve learning for these students, including small class sizes, extended learning time and one-on-one tutoring. The benefits of increased funding for low-income students are clear. More money means they stay in school longer, are more likely to graduate from high school and have higher earnings as adults and lower poverty rates.[8]
New Definition for Economically Disadvantaged Students Cuts Qualifiers in Half
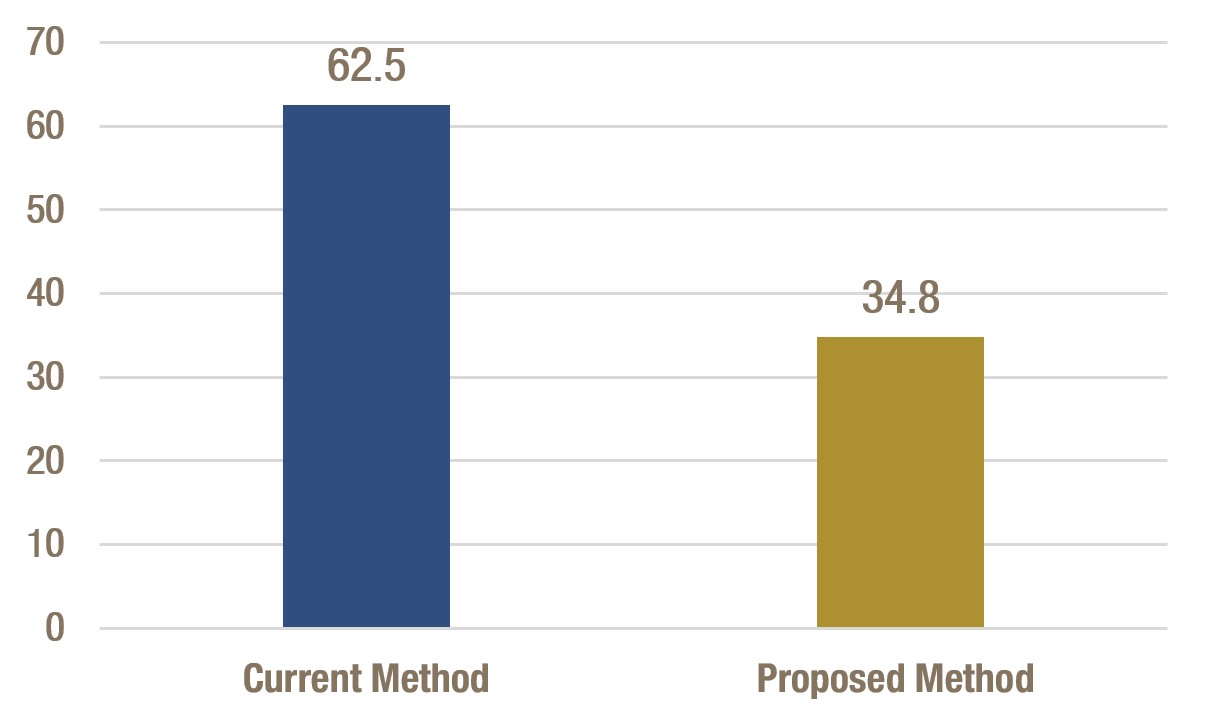
The commission proposes a new way to identify economically disadvantaged students, which cuts the percentage of these students nearly in half.
The national standard to measure economically disadvantaged students has been their participation in the federal lunch program. The program provides free lunches to students whose family income is up to 130 percent of the federal poverty line, which is $26,208 for a family of three in the 2016-2017 school year. It offers reduced price lunches to students whose family income is between 131 and 185 percent of the federal poverty line, up to $37,296 for a family of three.[9] In the 2015-2016 school year, 62.5 percent of Georgia’s public school K-12 students, or more than 1 million children, participated in the program.
Recent changes to the program’s eligibility criteria at the federal level could misidentify non-poor students as low-income. In response, the funding committee recommends defining economically disadvantaged students as children who:
- Live in a family unit receiving Supplemental Nutrition Assistance Program (SNAP) benefits
- Live in a family unit receiving Temporary Assistance for Needy Families (TANF) benefits
- Are identified as homeless
- Are identified as living in foster care
- Are identified as migrant
Under the new criteria, the percentage of students who qualify as economically disadvantaged falls to 34.8 percent from 62.5 percent under today’s formula.[10]
Chart 2: Percent of Economically Disadvantaged Students Shrinks Under Proposed Formula
 The strict eligibility requirements Georgia uses for the TANF and SNAP programs are the cause of this sharp decline. These guidelines are more restrictive than the criteria for the subsidized lunch programs. To qualify for TANF benefits, families of three in Georgia must earn less than $784 per month, or about $9,400 annually.[11] In the 2015 fiscal year, fewer than 26,000 Georgians got TANF benefits. Eligibility for the SNAP program is limited to families earning up to 130 percent of the federal poverty level, well below the criteria that many other states set.[12] Florida, North Carolina and Nevada are among the states that set eligibility at 200 percent of the poverty line. Texas, Minnesota and others use 165 percent. With a revised definition for low-income students, the proposed criteria exclude all children whose family incomes fall between 131 and 185 percent of the federal poverty line from receiving the supplemental amount for economically-disadvantaged students.
Compounding this omission is the relatively low participation rate in the SNAP program. About 25 percent of eligible Georgians do not participate in the SNAP program.[13] A reliance on this new eligibility criteria undercuts students who might need additional resources and limits a school’s ability to meet those needs.
Reallocating Transportation Dollars Puts Rural Districts at a Disadvantage
The proposed formula eliminates a grant program for student transportation, which is included in the QBE formula. Money now distributed through this grant is set to be redirected to the student base amount. This poses a problem for districts. District spending to bus students varies considerably across Georgia and shifting transportation dollars puts districts with higher than average per student transportation costs at a disadvantage. Districts spent $455 per student on average to bus them to and from school safely in the 2015 fiscal year. In all, 108 districts spent more than that and 54 invested at least $100 more. Six spent $900 or more per student. The gap between the average and higher expenses could be partially offset for districts that receive a Low Density grant but others with high transportation costs may need to divert local funds to pay for busing expenses now covered by the state.
Transferring transportation funding into the student base cost calculation also cements in the state’s current underfunding of student transportation. State funding for busing has been shrinking for two decades. The state contributed less than 17 percent to districts’ transportation costs in the 2013-2014 school year, down from 33 percent in the 2003-2004 school year and 49 percent in the 1995-1996 school year.[14]
Funding Not Based on an Assessment of Costs
The commission did not assess the cost of educating Georgia’s students to the state’s current performance standards. Instead, it focused on ways to redistribute the amount of money calculated by the existing 31-year-old formula if the current austerity cut of $166 million is eliminated. (See Appendix A for more information about austerity cuts.) Cost assessments are common when states examine and revise school funding. Recent examples include the Maryland effort now underway, Wyoming, which finished one in 2015, and Michigan, which completed one in early 2016.[15],[16],[17]
The potential elimination of austerity cuts, which added up to more than $9 billion between fiscal years 2003 and 2017, is valuable progress. But the core question remains: How much does it cost to educate all of Georgia’s students to the level of achievement the state now expects?
Answering this question is critical. The state instituted the Georgia Standards of Excellence, which define what students should know and be able to do at each grade level. These standards far surpass the state’s expectations for students in 1985. The state’s investment in students should match its goals for them. This is particularly urgent for economically disadvantaged students who benefit significantly from added dollars.
State Undermines Funding Restoration
State Undermines Funding Restoration, Shifts $400 Million in Costs to Districts
The General Assembly has reduced the austerity cut since fiscal year 2014, the fifth consecutive year it hit $1 billion. This reversal of the austerity cut is improving school districts’ finances. Most are back to the standard 180-day school calendar and have ended teacher furloughs. Some are again able to hire new teachers and provide a pay raise. The money does not go as far as before, however, because the state is shifting costs it once covered to the district level. The state paid a portion of the cost of health insurance for school bus drivers, food service workers and other non-certified district employees until it stopped in 2012 when it shifted the expense to districts. Monthly payments from districts for each non-certified employee soared from $246 in the 2012 fiscal year to $846 in fiscal year 2017. Districts are spending over $400 million more to provide these workers with health insurance.
At the same time, state funding for student busing decreased. Georgia is spending nearly 34 percent less per student to bus them to and from school in the 2017 fiscal year than in 2000. Districts now spend more of their local funds on insurance and busing that could be used in the classroom.
The Education Reform Commission
The governor created the reform commission in January 2015 to examine the state’s public education system and make recommendations to improve it. The commission focused on five areas, including school funding.[18] It met throughout 2015 and submitted its final report to the governor in December 2015. The governor delayed taking action on most of the recommendations during the 2016 legislative session but is expected to push for action on them in 2017.
The Reform Commission’s Proposed Funding Formula
The commission used a student-based funding model. This approach provides a base amount to districts for each student. Districts receive a supplemental amount for students with greater academic needs. The additional amount is determined by a weight applied to the base amount. To describe how this works, under the proposed formula, the base amount is $2,393. Students in kindergarten through third grade comprise one of the weighted categories. The weight assigned to their category is 0.2872, which multiplied by the base amount, equals $687. These students are allotted a total of $3,080, the $2,393 base amount plus a $687 weighted amount.
The base and weighted amounts can be used without restriction by districts that operate as charter or strategic waiver school systems, which covers 178 of Georgia’s 180 districts. These districts gain this flexibility by entering agreements with the Georgia State Board of Education to meet specific student learning goals. Today’s QBE formula controls spending with regulations for maximum class sizes, teacher salaries, counselor-to-student ratios and other factors. The two remaining districts that are not charter or strategic waiver systems will continue to be required to meet current regulations under the proposed formula.
Proponents say this flexibility increases a district’s efficiency. They argue this system allows districts to direct state money to programs and policies school leaders can tailor to best suit their students’ particular needs and improve achievement without more dollars.[19] Empirical research on this claim is limited and its findings are inconclusive.[20]
Key Components of the Reform Commission’s Formula
In addition to base and weighted amounts distributed by types of students, the proposed formula includes grants for specific purposes. It also changes how the state funds teachers’ salaries and how teachers are paid.
Student Categories
The commission created 13 student categories. One serves as the base category and 12 are tailored for students with greater academic needs. Districts would receive the base amount for each student and the supplemental weighted amount for students in the other 12 categories. This is similar to the structure of today’s formula, which also classifies students by category with one serving as the base and 17 determining supplemental funding. (See Appendix B for a listing of QBE formula categories.)
Table 1: Student Categories and State Funding Levels
| Student Category | Base Amount | Weight | Weighted Amount | Total |
| Grades K-3 | $2,393.13 | 0.2872 | $687.21 | $3,080.63 |
| Grades 4-5 | $2,393.13 | 0.0800 | $191.45 | $2,584.66 |
| Grades 6-8 (Base) | $2,393.13 | 1.0000 | $- | $2,393.13 |
| Grades 9-12 | $2,393.13 | 0.0822 | $196.72 | $2,589.93 |
| Career, Technical & Agricultural Education |
$2,393.13 | 0.0502 | $120.02 | $2,513.20 |
| Special Education, Category A | $2,393.13 | 0.4089 | $978.58 | $3,372.12 |
| Special Education, Category B | $2,393.13 | 0.7099 | $1,698.82 | $4,092.66 |
| Special Education, Category C | $2,393.13 | 1.7762 | $4,250.79 | $6,645.70 |
| Special Education, Category D | $2,393.13 | 2.4710 | $5,913.44 | $8,309.04 |
| Special Education, Category E | $2,393.13 | 4.8947 | $11,713.54 | $14,111.56 |
| English to Speakers of Other Languages |
$2,393.13 | 0.1937 | $463.62 | $2,856.94 |
| Economically Disadvantaged | $2,393.13 | 0.0970 | $232.23 | $2,625.46 |
| Gifted | $2,393.13 | 0.3231 | $773.15 | $3,166.60 |
Students in sixth through eighth grades are allotted the base amount in the proposed formula because committee members concluded they require fewer resources than other types of students, such as children in kindergarten through third grade.[21] More money is allotted for these young students to ensure they read on grade level by the end of third grade. Schools would be allotted funding for each category where a student qualifies. An economically disadvantaged eleventh grader will be allotted a total of $2,822.08, or $2,393.13 for the base amount, $196.72 for the grade level and $232.23 for the financial situation, for example.
Most categories in the commission’s proposal are similar to the current formula though there are two notable changes. The category of economically disadvantaged students is new in the proposed formula.
The proposal also eliminates categories for students who are behind academically, Early Intervention Program for kindergarten through fifth grade students and Remedial Education Program for children in sixth to 12th grades.
Special Funding Programs
The proposed formula includes components of today’s formula and creates new ones. This money is in addition to the base and weighted student amounts.
The commission does not recommend changes to the following programs, which are part of the QBE formula:
- Funding for the State Health Benefit Plan, which provides health insurance to district employees
- Funding for the Teacher Retirement System
- Equalization grants, which provides supplemental money to districts with low property wealth. Though unchanged by the commission’s proposal, the equalization program was cut considerably by state lawmakers in 2012. (See Appendix C for more details.)
The commission also proposes to leave the Local 5 Mill Share contribution intact. That determines the minimum amount each district is required to contribute.
The commission suggests changing other special categories in today’s formula, most importantly sparsity grants and funding for school transportation. The commission also added central office and administration costs as an area of specialized funding. This money is intended to ensure every district can afford a superintendent, an accountant and a secretary, and two to 16 assistant superintendents or other certified staff based on enrollment.
Sparsity Grants Become Low Enrollment/Density Grants
The sparsity grant program helps offset the higher operating costs of small schools. The proposed new version, called Low Enrollment/Low Density grants, would provide grants to non-city districts with enrollments of 3,500 or less, or those with fewer than six students per square mile. Districts that qualify as either low enrollment or low density do not receive a grant if they are in the top quintile in tax digest per student. This restriction does not apply to districts that are both low enrollment and low density. Those districts can receive a grant even if they are in the top quintile. Local districts would also be required to comply with the equalization program millage rates:
- 13 mills by July 1, 2017
- 5 mills by July 1, 2018
- 14 mills by July 1, 2019.[22]
Transportation and Nursing Grants Eliminated and Moved to the Base Formula
The proposed formula eliminates grant programs for student transportation and school nurses, which are included in the QBE formula. Money now distributed through these grants would be redirected to the student base amount.
How Teachers are Paid
The commission recommends the state use a new method to fund teachers’ salaries. The proposal says the state will provide districts with the 2016 statewide average teacher salary of $50,768 for each teacher. This money would be included in the student base amount. This is not the amount teachers will be paid. Districts would be required to design or adopt new teacher compensation models to distribute this money to teachers. The models would need to include a measure of teacher effectiveness.
So if a district has four teachers the state will provide it with $203,072 for salaries. The district could choose to pay two teachers $41,000 each and two $60,536 each. Or one salary could be $43,000, the second $48,000, the third $55,000 and the fourth $57,072. Or the pay could be at other levels the new compensation model sets.
These methods would immediately apply to all new teachers. The salaries of current teachers will continue to be funded by the state under today’s formula except those who choose their districts’ new compensation model or who are moved to those models as part of their districts’ charter or strategic waiver systems’ plans.
The committee’s recommendations differ from the QBE formula, which has two components to state funding for teacher salaries. The first is the base salary, which is included in the amounts assigned to each student category. The base salary is $33,424 for a first-year teacher with a bachelor’s degree. The legislature has not increased the base salary and any other salary level since the 2009 fiscal year.
The second component is a supplement provided to each teacher based on years of experience and advanced degrees in the relevant teaching subject. The inclusion of advanced degrees and experience in the QBE formula increases state funding annually for teachers’ salaries. This money serves in part as an inflation adjustment since the QBE formula does not include one.
The formula proposed by the commission lacks a mechanism to adjust the recommended teacher salary for inflation or otherwise trigger regular increases in state funding. Instead it relies on the General Assembly to review the teacher salary levels each year and make adjustments as deemed appropriate in the annual state budget process. Given the legislature’s history of infrequent updates to teachers’ salaries and other elements of the QBE formula, routine funding increases could remain uncommon. Districts with limited ability to raise local revenue to keep pace with inflation could find it more difficult to attract and retain teachers. Pay for Georgia’s teachers already trails that of workers with similar education levels by about 30 percent.[23]
Pay for Performance
Pay for Performance: Uncertainty about Its Impact on Students and Teachers
Growing interest in changing teacher compensation to a performance system from one based on advanced degrees and experience raises questions about the benefits of such a change, including what effects do performance pay models have on student achievement?
Research on the effect of performance pay on student achievement is mixed. A study of New York City’s performance pay model did not find evidence of improved student achievement.[24] A study of the performance pay system in Nashville, Tenn. found it had largely no effect on student achievement.[25] Researchers examining the pay for performance program in Austin, Texas found positive gains in student test scores in the first year of implementation but no gains in the second year.[26] A review of Minnesota’s voluntary pay for performance plan found a positive effect on student achievement, though inexperienced teachers had the most productivity gains.[27] A recent study from Texas that compared performance plans across districts found no impact on student achievement but reduced teacher turnover.[28] This study and another examining the implementation and effect of an incentive pay model implemented in urban charter schools highlight the difficulty designing and implementing effective performance pay programs.[29]
This range of results indicates changes in teacher compensation should first be tested and their impact on students and teachers should be rigorously evaluated. Compensation models should be refined to best support good results.
Recommendations
The Education Reform Commission’s proposed formula is a solid start to building a formula that better meets the needs of Georgia’s students. It provides flexibility to district leaders, enhancing their abilities to better match resources with the instructional and organizational practices they believe best meet their students’ learning needs. It falls short in critical areas, however. To repair them, the General Assembly can:
- Incorporate an annual inflation adjustment to ensure funding keeps up with growing needs. State funding should be adjusted annually in line with the Consumer Price Index calculated by the U.S. Bureau of Labor Statistics. In addition, a legislative task force should be convened every three years to review and recalibrate the base and all weighted amounts to ensure they accurately reflect the cost of educating students in each funding category. The task force should also ensure teacher salaries are competitive with professionals in fields requiring comparable education levels.
- Increase funding for students, schools and districts with above-average needs. Georgia can’t thrive in a rapidly evolving 21st century economy unless students get sufficient resources to meet the goals the state has set for them and get prepared to succeed in postsecondary programs and the workforce. This is particularly true for low-income students who benefit significantly from sustained funding increases. Lawmakers can make progress toward the goal of providing adequate funding with two targeted, straightforward reforms to the proposed formula.
- Increase the amount allotted to economically disadvantaged students to at least $600. That’s about what Georgia would allocate if the weight for the supplemental funding allotted to these students met the national average.[30]
- Establish a High-Needs Grant program for schools where 55 percent or more of unduplicated students are economically disadvantaged or English language learners. Schools with large concentrations of high needs students often confront additional barriers to student learning. Several states provide additional funding to these schools to ensure they can offer the full scope of support their students need. The grant program could modeled after California’s as part of its student-based funding reform.
- Broaden the proposed methodology to identify economically disadvantaged students. To ensure that all economically disadvantaged students receive the resources needed to succeed academically, the methodology to identify them should be revised to include a broader set of measures than just SNAP or TANF eligibility. Guidance offered by the National Forum on Education Statistics indicates that adding family income data for students to the mix would capture a comparable portion of economically disadvantaged students.[31] The approach adopted by California and other states may also offer reliable models for identifying economically disadvantaged students.[32] (See Appendix D for more about California’s approach.)
- Maintain a separate grant program for student transportation. Counting transportation money as part of the base student amount threatens to shortchange rural areas and other districts with high transportation costs.
Lawmakers can also require and fund an evaluation of the impact of the new formula to ensure its ongoing effectiveness. A useful evaluation can look at:
- Equity in distribution of funding
- Services to economically-disadvantaged students and outcomes
- Teacher recruitment, retention and distribution
- Cost studies of high performing schools
An evaluation can provide critical information about the impact funding changes have, particularly on low-income students. It can provide critical information about school and district level practices, student outcomes and associated costs.
Without these essential course corrections to the reform commission’s proposal, schools and districts will lack resources needed to ensure that all children master the knowledge and skills needed to be successful in postsecondary programs and the workplace.
Georgia’s current school funding formula has stood for 31 years. It is likely the next one will stand for many years as well. Georgia needs to get this right.
Appendices
Appendix A: Austerity Cuts and the Commission’s Recommended Funding Level
The commission initially focused on maintaining state funding levels in the new formula the same as the General Assembly appropriated for the 2016 fiscal year. This amount was set by the QBE formula, minus an austerity cut of $466 million passed by lawmakers. It was the 14th consecutive year the legislature allotted less than the amount called for in the QBE formula. From 2010 to 2014, the austerity cut topped $1 billion each year. Districts coped with the huge funding shortfall by eliminating teaching positions, increasing class sizes, shortening the school year, furloughing employees, reducing or eliminating student programs and draining reserves. The legislature reduced the cuts in the 2015 and 2016 budgets, which helped stabilize school districts’ finances but many still struggled.
The funding committee recognized more money would be needed in the new formula. It recommends $258 million be added to the K-12 budget in the 2018 fiscal year and an additional $209 million when funds are available. Combined, this would eliminate the austerity cut of $466 million in the 2016 budget. The funding levels cited in the commission’s report and used here include the full amount eventually recommended by the commission.
The Legislature pre-emptively restored $300 million to the QBE funding level in the 2017 fiscal year, reducing the austerity cut to $166 million and helping school systems afford to end teacher furloughs, hire teachers to begin reducing class sizes and restore or expand programs to support student learning. Still, even if austerity cuts are a thing of the past, the question remains: How much does it cost to educate all of Georgia’s students to the level of achievement the state now expects?
| Fiscal Year | Austerity Cut |
| 2003 | $(134,933,642) |
| 2004 | $(283,478,659) |
| 2005 | $(332,838,099) |
| 2006 | $(332,835,092) |
| 2007 | $(169,745,895) |
| 2008 | $(142,959,810) |
| 2009 | $(495,723,830) |
| 2010 | $(1,355,168,599) |
| 2011 | $(1,089,521,696) |
| 2012 | $(1,147,859,436) |
| 2013 | $(1,143,762,797) |
| 2014 | $(1,061,127,407) |
| 2015 | $(746,769,852) |
| 2016 | $(466,769,851) |
| 2017 | $(166,769,853) |
| Cumulative Austerity Cut | $(9,070,264,518) |
Appendix B: QBE Student Categories
| Categories |
| Kindergarten |
| Kindergarten Early Intervention Program |
| Primary Grades (1-3) Program |
| Primary Grades (1-3) Early Intervention Program |
| Upper Elementary (4-5) Program |
| Upper Elementary (4-5) Early Intervention Program |
| Middle School Program |
| Grades 9-12 (Base) |
| Career, Technical and Adult Education (9-12) Program |
| Special Education I |
| Special Education II |
| Special Education III |
| Special Education IV |
| Special Education V |
| Gifted |
| Remedial Education Program |
| Alternative Education Program |
| English for Speakers of Other Languages Program |
Appendix C: Equalization Grants: Downsized in Earlier Reforms
Districts with low property wealth raise less local revenue through property taxes than those with higher property wealth. The state offsets these disparities through equalization grants but these grants reach fewer districts now than in previous years.
The state provides these grants to districts whose per student property tax digest wealth is below the statewide average. The grants fill the gap between the local property tax revenue these districts raise per mill and what they would get per mill if their per student tax digest wealth equaled the state average.
Districts whose per student property tax value was below the 90th percentile received an equalization grant when the QBE formula was first implemented. The state equalized funding for 3 mills above the five mills required in the QBE formula until 1990 when it was raised to 3.25 mills. The benchmark required for participation was lowered to the 75th percentile in 2000 though the state increased the number of mills it would equalize to 15 mills above the required five.[33]
The state stopped fully funding the equalization program in fiscal year 2010. Districts should have received over $600 million that year according to the equalization formula but instead got $436 million.[34] The program was underfunded again in fiscal years 2011 and 2012. In 2012 the legislature approved changes to the program that significantly lowered the calculated cost of the program. It reduced the qualifying benchmark to the statewide average. It eliminated the nine districts with the highest per student property tax digest wealth and the nine with lowest from the calculation of the statewide average, which shifted the average downward.[35] Legislators also required districts to set higher millage rates to qualify for equalization grants:
- 12 mills by July 1, 2015
- 12.5 mills by July 1, 2016
- 13 mills by July 1, 2017
- 13.5 mills by July 1, 2018
- 14 mills by July 1, 2019
As a result of these changes, funding for the equalization program in fiscal year 2017 is $57 million less than it was in 2009, the last year the program was fully funded under the previous formula even though full-time equivalent enrollment has climbed by more than 103,000.
Appendix D: Alternative Approaches to Identify Economically Disadvantaged Students
California identifies economically disadvantaged students as those:
- Enrolled in non-Community Eligibility Program (CEP) schools who participate in the federal Free and Reduced Lunch program
- Enrolled in CEP schools who participate in the federal lunch program through direct certification
- Enrolled in CEP schools whose family income meets the criteria of the federal lunch program
Schools are required to collect family income data either using the application for the federal free and reduced lunch program or through an alternative form.
Endnotes
[1] U.S. Census Bureau. (2015) Public Education Finances: 2014. Washington, DC.
[2] Baker, B., Farrie, D., Luhm, T. & Sciarra, D. G. (2016) Is School Funding Fair? A National Report Card, Fifth Edition. Education Law Center and Rutgers Graduate School of Education.
[3] Turner, C., Khrais, R., Lloyd, T., Olgin, A., Isensee, L., Vevea, B., & Carsen, D. (2016) Why America’s schools have a money problem. National Public Radio.
[4] Jackson, C. K., Johnson, R., & Persico, C. (2014). The effect of school finance reforms on the distribution of spending, academic achievement, and adult outcomes. National Bureau of Economic Research.
[5] The Governor’s Education Review Commission. (1984) Priority for a Quality Basic Education: A First Report to Governor Joe Frank Harris and the Georgia General Assembly. Atlanta, GA.
[6] According to the state salary schedule, teachers receive an annual salary increase based on years of experience and graduate degrees for their first eight years teaching. From years nine to 20, their salaries are increased biennially. The state does not provide an increase after 20 years.
[7] The 20 mill cap does not apply to city school districts. In addition, county districts that levied a millage rate above 20 mills in 1983 when the Georgia constitution was revised, are allowed to go above the cap. (Rubenstein, R. & Sjoquist, D. (2003). Financing Georgia’s Schools A Primer. Atlanta, GA: Georgia State University.
[8] Jackson, C. K., Johnson, R., & Persico, C. (2014). The effect of school finance reforms on the distribution of spending, academic achievement, and adult outcomes. National Bureau of Economic Research.
[9] U.S. Department of Agriculture. (2016) Child Nutrition Programs: Income Eligibility Guidelines, Federal Register, Vol. 81, No. 56.
[10] Governor’s Office of Student Achievement. Comparing Measures of Economically Disadvantaged Students in K-12 Funding Formula. April 28, 2015.
[11] Georgia Division of Family and Children Services. TANF Eligibility Requirements. Retrieved from http://dfcs.dhs.georgia.gov/tanf-eligibility-requirements
[12] U.S. Department of Agriculture. (2016.) Broad-Based Categorical Eligibility.
[13] Baker, B., Farrie, D., Luhm, T. & Sciarra, D. (2016). Is School Funding Fair: A National Report Card. Fifth Edition. Education Law Center and Rutgers Graduate School of Education.
[14] Suggs, C. (2015) School Districts Get Growing Tab for Student Transportation. Atlanta, GA: Georgia Budget and Policy Institute.
[15] See the Maryland Department of Education’s website for information on the school funding adequacy study that is currently being conducted: http://marylandpublicschools.org/adequacystudy/
[16] Odden, A. & Picus, L. (2015) 2015 Wyoming Recalibration Report Prepared for the Wyoming Select Committee on School Finance Recalibration.
[17] Augenblick, Palaich & Associates Consulting. (2016). Michigan Education Finance Study.
[18] The other issue areas are: teacher recruitment, retention and compensation; expanding school choice; early childhood education; and “move on when ready,” which considers how students may move ahead based on mastery of subject content rather than seat time.
[19] Hassel, B., Doyle, D., & Locke, G. (2012) Smarter funding, better outcomes: Georgia’s roadmap for K-12 finance reform. Atlanta, GA: Georgia Chamber of Commerce. Retrieved August 19, 2016.
[20] Curtis, K., Sinclair, K., & Malen, B. (Undated). Student-based budgeting (SBB) as an education reform strategy: theory and evidence. Paper presented at the 39th annual conference of the Association for Education and Finance Policy. Retrieved August 19, 2016.
[21] Governor’s Office of Student Achievement. Weighting Considerations. April 28, 2015.
[22] To be eligible for an equalization grant, districts must have a millage rate of 12.5 mills by July 1, 2016, 13 mills by July 1, 2017, 13.5 mills by July 1, 2018, and 14 mills by July 1, 2018.
[23] Baker, B., Farrie, D., Luhm, T. & Sciarra, D. (2016). Is School Funding Fair: A National Report Card. Fifth Edition. Education Law Center and Rutgers Graduate School of Education.
[24] Fryer, R. G. (2013) Teacher incentives and student achievement: evidence from New York City public schools, Journal of Labor Economics, 31:2
[25] Springer, M.G., Ballou, D., Hamilton, L., Le, V., Lockwood, J.R., McCaffrey, D., Pepper, M., & Stecher, B. (2010). Teacher Pay for Performance: Experimental Evidence from the Project on Incentives in Teaching. Nashville, TN: National Center on Performance Incentives at Vanderbilt University
[26] Sojourner, A. J., Mykerezi, E., & West, K.L. (2014) Teacher pay reform and productivity: panel data evidence from adoptions of Q-Comp in Minnesota. The Journal of Human Resources 49:4, 945-981
[27] Balch, R. and Springer, M. (2015) Performance pay, test scores and student learning objectives. Economics of Education Review 44. 114-125
[28] Springer, M. & Taylor, L. (2016). Designing Incentives for Public School Teachers: Evidence from a Texas Incentive Pay Program, Journal of Education Finance 41:3, 344-381.
[29] Kaimal, G & Jordan, W.J. (2016). Do Incentive-Based Programs Improve Teacher Quality and Student Achievement? An Analysis of Implementation in 12 Urban Charter Schools. Teachers College Record 118:7, 1-34.
[30] The national average is for the low-income supplemental weighted amount to equal 25 percent of the per student base amount.
[31] California Department of Education. (Undated) LCFF Frequently Asked Questions. Retrieved from http://www.cde.ca.gov/fg/aa/lc/lcfffaq.asp#PROV2and3
[32] National Forum on Education Statistics. (2015). Forum Guide to Alternative Measures of Socioeconomic Status in Education Data Systems. (NFES 2015-158). U.S. Department of Education. Washington, DC: National Center for Education Statistics. Retrieved from http://nces.ed.gov/pubs2015/2015158.pdf.
[33] State Education Finance Commission. Issue Paper: Equalization. Atlanta, GA: Georgia Department of Education.
[34] State Education Finance Commission. Issue Paper: Pupil Transportation. Atlanta, GA: Georgia Department of Education.
[35] Johnson, C. (2012). Bill Analysis: HB 824. Atlanta, GA: Georgia Budget and Policy Institute.