
Updated September 23, 2025
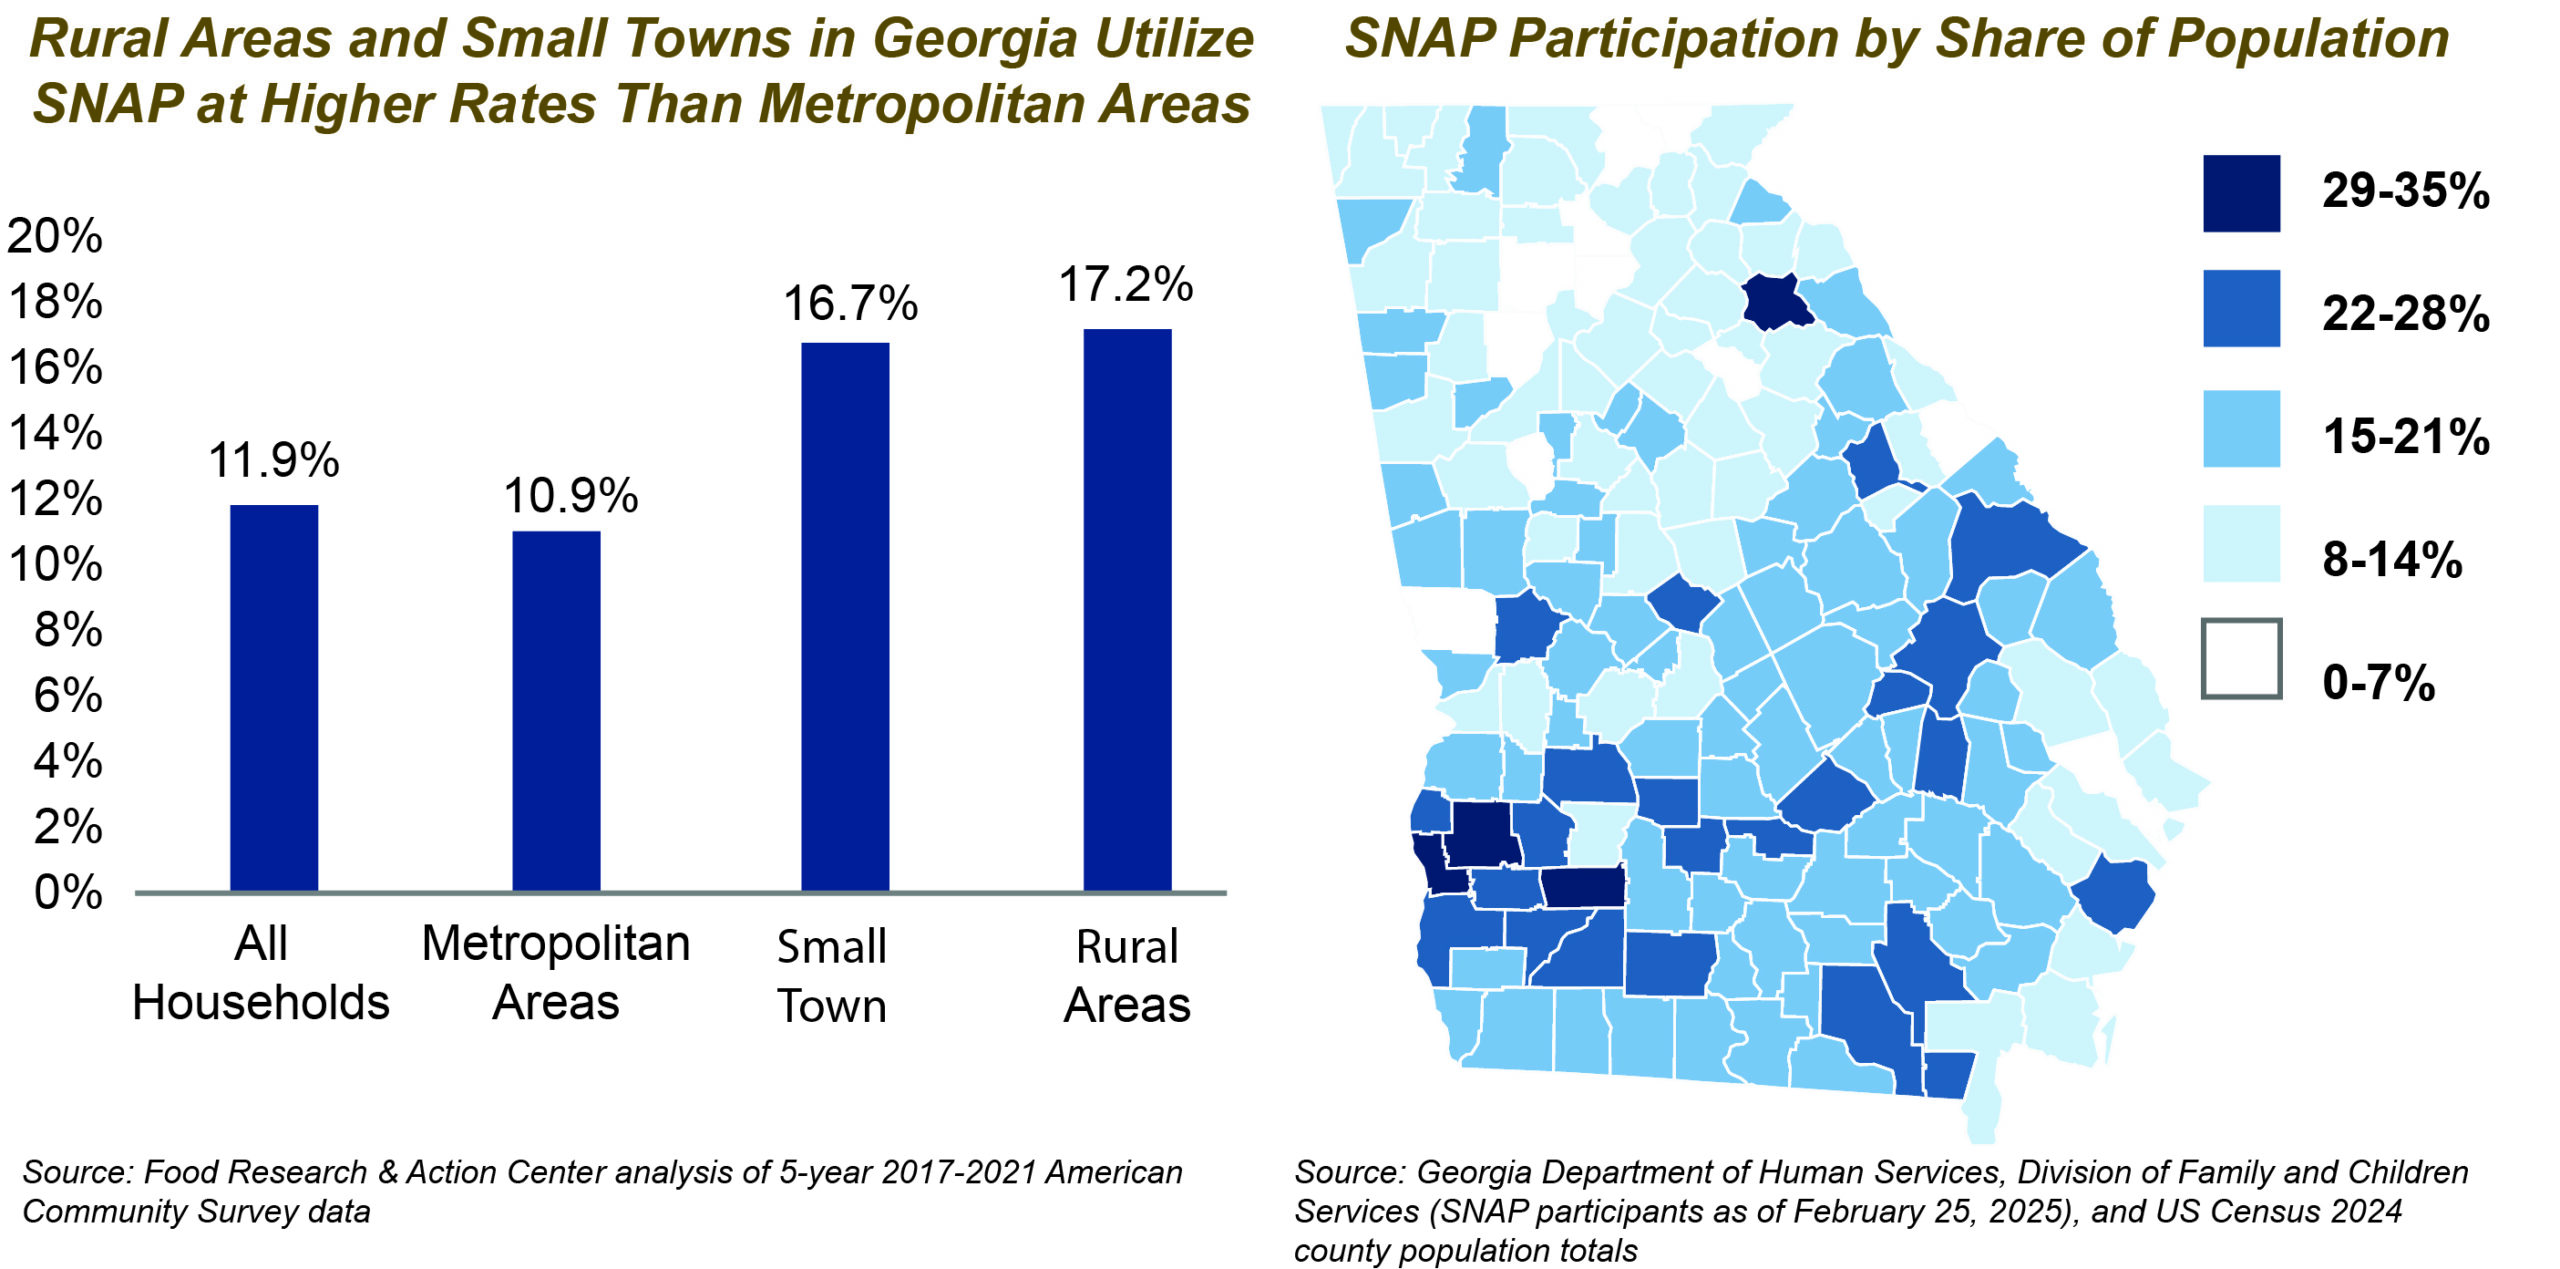
The Supplemental Nutrition Assistance Program (SNAP) is a proven and effective tool to reduce food insecurity, help improve health outcomes, bolster local economies and support workers with low wages.[1] SNAP, also known as food stamps, helps about 1.4 million people, or 700,000 Georgia households, with a fixed income, low income or modest or unpredictable earnings, afford the cost of food, especially when the economy is weak or when food costs are high. Georgia’s rural areas and small towns utilize SNAP at greater rates than larger metropolitan areas. SNAP supports many local businesses, especially in rural areas.
This paper provides an overview of key SNAP issues related to eligibility and benefits, funding, the program’s role in reducing food insecurity and more. It also includes some details about forthcoming funding and eligibility changes to the program as a result of H.R. 1 (formerly known as the One Big Beautiful Bill Act), an unprecedented tax and spending bill that will cut SNAP and Medicaid to partially pay for tax cuts for wealthy individuals and corporations. Some of the provisions have unclear implementation timelines, and some have implementation timelines after this paper’s publishing date.
What are the SNAP Eligibility Limits and Benefit Levels?
SNAP targets people with the lowest levels of income. However, income is only one factor in determining eligibility and benefit levels. State SNAP agencies also consider major expenses like housing costs and whether certain adults are working.
Income Eligibility
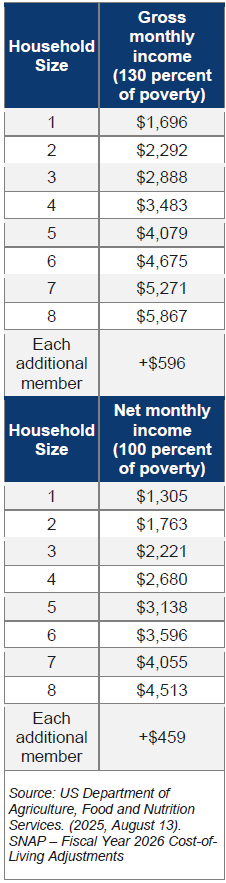 There are several factors that affect SNAP eligibility. First, applicants who are not seniors (60 or older) or disabled must meet two income tests. The first test is the gross income, or total
income, which must be at or below 130% of the poverty line (or $3,483 a month for a family of four). Applicants who are seniors or who have a disability must meet a gross income limit equal to or less than 165% of the poverty line (about $2,909 a month for a family of two).[2] In Georgia, seniors or people with a disability who receive Temporary Assistance for Needy Families (TANF) Community Outreach Services (TCOS) are automatically eligible for SNAP if their gross income is within 200% of the poverty line.[3]
The second test assesses if the household’s net income (gross income minus deductions like housing costs) is at or below 100% of the federal poverty line (or $2,680 a month for a family of four).
Benefits
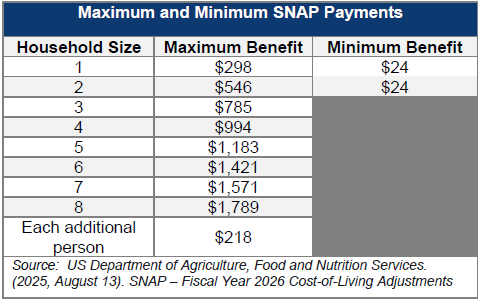
The SNAP program assumes households spend 30% of their net income on food. Families with no net income can receive the maximum SNAP payments. For other households, benefits are determined by subtracting 30% of the family’s net monthly income from the maximum benefit.[4] A typical SNAP household receives about $6 per person per day each month.
Time Limits and Work Reporting Requirements
One of the eligibility rules that is particularly harmful for adults in the SNAP program is the time limit that states enforce when individuals do not meet the work reporting requirement.
SNAP requires adults without a disability and without a child in the home to comply with work rules. (These adults were called Able Bodied Adults without Dependents – ABAWDs.) H.R. 1 expands work requirements to include adults up to age 64 and parents or caregivers living with children aged 14 to 17.
Acceptable activities that fulfill the work reporting requirement include working, enrolling in an approved training program or volunteering at a nonprofit for at least 20 hours a week. Adults subject to the reporting requirement have a three-month time limit to receive SNAP if they are not fully complying with this requirement or do not meet an exemption.[5] Adults who are unable to meet the work reporting requirement can only receive SNAP for three months in a 36-month period.
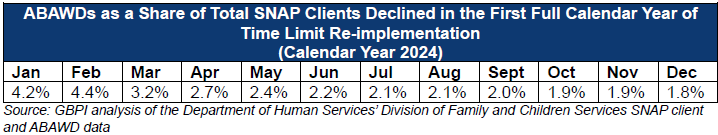
Research finds that work reporting requirements are not very effective at improving people’s economic security. Instead, they do a better job kicking people off assistance.[6] The time limit for ABAWDs not meeting work requirements was reinstated after the end of the nationwide COVID-19 public health emergency in 2023.[7] Additionally, in 2023, the state walked away from a decades-long precedent to seek waivers from the time limit for areas of the state where many people struggle to find jobs. In 2024, the first full calendar year after these changes, Georgia saw a nearly 30,000-person decline among ABAWDs enrolled in SNAP.[8] This drop did not correspond to changes in the overall SNAP caseload, as the number of ABAWDs as a share of the total SNAP caseload also declined. (See table.)
Who Receives SNAP in Georgia?
According to DHS, 1.4 million clients utilized SNAP in 2024.[9] That includes about 640,000 children. The program also reaches seniors, people with disabilities, veterans, families, and adults between jobs or working for low wages. About 28% of SNAP households have either a senior or a disabled adult, and about 69% of households have a child (these numbers are not mutually exclusive).
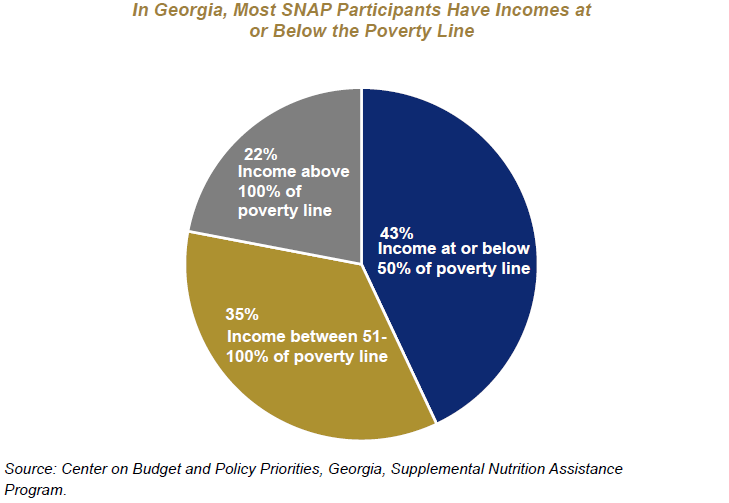
Households receiving SNAP benefits have very low incomes. In 2023, about 78% of SNAP households had income at or below the poverty line, with about 43% in deep poverty, half the poverty line.[10]
There are certain immigrant restrictions on SNAP. People without a documented immigration status cannot access SNAP. However, some immigrants, such as legal permanent residents with low income, can access SNAP under certain conditions. H.R. 1 made new exclusions for certain lawfully present immigrants who were previously able to access SNAP. Once this provision is implemented, low-income lawfully present immigrants who have been granted humanitarian protections, including refugees, people granted asylum, and certain survivors of domestic violence or labor or sex trafficking, among others, will no longer be eligible for SNAP.[11] It is not clear when this new exclusion will be implemented, but more than 5,000 people will losr SNAP as a result[12]
How is SNAP Funded and Structured?
Historically, the state and federal governments shared equally in the administrative costs of the program, and the federal government paid 100% of SNAP benefits to households enrolled in the program. However, H.R.1 fundamentally changes the funding structure of SNAP.
Starting in federal fiscal year (FFY) 2027 (October 2026), the state will have to cover 75% of state administrative costs. The requirement means Georgia would need to appropriate more funds for SNAP administration to keep the funding level. If not, overall SNAP administrative funding will decline.
Additionally, states will have to cover a share of the cost of SNAP benefits under certain conditions. If a state pays and how much a state pays will be based on the state’s payment error rates, which are overpayments or underpayments to clients based on state caseworker or client mistakes. Starting in FFY 2028, states with error rates of 6% or greater will have to cover a share of SNAP benefits. States can choose to be measured on error rates from 2025 or 2026 for the first year of implementation, which is 2028.[13] In subsequent years, they must use error rates from three years prior. If the state has an error rate:
- Between 6% and 7.99%, it will be required to pay 5% of the SNAP benefits. Based on 2024 spending, 5% would equal $162 million for the state of Georgia.
- Between 8% and 9.99%, it will be required to pay 10% of SNAP benefits. Under 2024 levels of spending, a 10% cost shift would be about $325 million for the state of Georgia.
- Greater than 10%, it will be required to pay 15% of SNAP benefits. Based on 2024 spending, 15% equals about $487 million for the state of Georgia.
The law temporarily postpones implementation of this provision for states with an error rate in FFY 2025 or FFY 2026 that is 13.33% or more. If a state meets this threshold in FFY 2025, implementation will be delayed until fiscal year 2029; if it applies to a state’s FFY 2026 error rate, implementation will be delayed until FFY 2030.[14] Georgia’s FFY 2024 error rate was 15.65.[15] If the state maintains this high payment error rate in FFY 2025 or FFY 2026, it would be eligible for a later start date but would be required to cover 15% of SNAP benefit costs.
Georgia leaders may decide they cannot afford the new cost and would have to lower their expenses by making it harder to access food assistance, or they could opt out of the program altogether. Both scenarios would create challenges for families with low incomes to afford groceries.
What is SNAP’s Impact on Food Security?
Feeding America estimates that in 2023, about .[16] The US Department of Agriculture, the federal agency that oversees SNAP, defines food insecurity as a “household-level economic and social condition of limited or uncertain access to adequate food.”[17] People who have income around the SNAP eligibility limit are less likely to be food insecure than people who are not income-eligible for SNAP. Among people who are food insecure in Georgia, an estimated 57% had incomes above the SNAP income threshold of 130% of the poverty line (about $42,000 a year for a family of four), while about 43% of people were below that threshold.[18] While not everyone at the lower income levels receives SNAP, many do. This provides some indication that SNAP helps reduce food insecurity when people have access to it.
Research demonstrates that SNAP reduces food insecurity. Research finds that the program reduces the likelihood of being food insecure by 30%.[19] One study found food insecurity fell by one-fifth when a household participated in SNAP, and that food insecurity fell by about a third among children after six months of SNAP receipt.[20] The program is particularly important during economic downturns as it readily responds when more households lose earnings and struggle to afford food.[21] Research finds one percentage point increase in unemployment increases SNAP enrollment by about 15 percent.[22] However, it is unclear how the program will respond to economic downturns after the SNAP provisions are fully implemented.
What is SNAP’s Impact on Health and Well-being?
SNAP helps support family economic security, health and child well-being. Every year between 2015 and 2019, SNAP lifted 250,000 Georgians, including 112,000 children, above the poverty line.[23] Researchers have identified several health and child development benefits to SNAP as well, including:
- Seniors who use SNAP are better able to afford their fully prescribed medication compared to other seniors with low income who do not have SNAP;[24] and
- SNAP participants incur about 25% less in medical costs in a year compared to non-participants.[25]
- The children of mothers who utilized SNAP while pregnant had better birth outcomes and better long-term health when compared to similar mothers and children who did not participate in SNAP. The same study also found that these children had greater financial security as adults than the comparison group;[26]
What is SNAP’s Impact on Communities and the State?
SNAP supports local economies, especially in rural areas. There are nearly 10,000 retailers in Georgia authorized to accept SNAP electronic benefit transfer (EBT) cards.[27] They range from superstores like Wal-Mart, traditional supermarkets, local grocery stores, convenience stores and farmers markets. They are located throughout the state in rural, suburban and urban communities. In 2024, the state issued about $3.2 billion in benefits to SNAP clients, which they then used in local businesses.[28] Data from the USDA show that during an economic downturn, $1 of SNAP generates between $1.50 to $1.80 in economic activity.[29]
Appendix: County-by-county SNAP recipients as a percent of the population
| County | 2024 County Count | 2024 SNAP recipients as a percent of population |
| Appling | 18,669 | 19% |
| Atkinson | 8,435 | 20% |
| Bacon | 11,045 | 21% |
| Baker | 2,732 | 28% |
| Baldwin | 43,644 | 16% |
| Banks | 20,318 | 11% |
| Barrow | 96,294 | 10% |
| Bartow | 117,508 | 11% |
| Ben Hill | 16,945 | 23% |
| Berrien | 18,666 | 19% |
| Bibb | 157,056 | 23% |
| Bleckley | 12,626 | 16% |
| Brantley | 18,795 | 19% |
| Brooks | 16,344 | 20% |
| Bryan | 51,105 | 6% |
| Bulloch | 85,454 | 12% |
| Burke | 24,472 | 22% |
| Butts | 27,127 | 14% |
| Calhoun | 5,441 | 22% |
| Camden | 59,099 | 9% |
| Candler | 11,130 | 19% |
| Carroll | 129,911 | 13% |
| Catoosa | 68,940 | 9% |
| Charlton | 13,021 | 13% |
| Chatham | 307,336 | 12% |
| Chattahoochee | 8,548 | 8% |
| Chattooga | 25,306 | 20% |
| Cherokee | 293,513 | 4% |
| Clarke | 129,995 | 11% |
| Clay | 2,815 | 31% |
| Clayton | 297,703 | 21% |
| Clinch | 6,871 | 23% |
| Cobb | 787,538 | 7% |
| Coffee | 43,851 | 20% |
| Colquitt | 46,977 | 22% |
| Columbia | 167,472 | 6% |
| Cook | 17,984 | 21% |
| Coweta | 158,233 | 8% |
| Crawford | 12,349 | 15% |
| Crisp | 19,468 | 27% |
| Dade | 16,068 | 10% |
| Dawson | 33,748 | 6% |
| Decatur | 29,391 | 21% |
| Dekalb | 770,307 | 14% |
| Dodge | 19,630 | 20% |
| Dooly | 11,186 | 20% |
| Dougherty | 82,418 | 30% |
| Douglas | 151,887 | 15% |
| Early | 10,444 | 27% |
| Echols | 3,698 | 20% |
| Effingham | 73,148 | 8% |
| Elbert | 20,152 | 18% |
| Emanuel | 23,224 | 23% |
| Evans | 10,869 | 20% |
| Fannin | 25,854 | 10% |
| Fayette | 125,107 | 5% |
| Floyd | 101,390 | 14% |
| Forsyth | 280,096 | 3% |
| Franklin | 25,208 | 14% |
| Fulton | 1,090,354 | 12% |
| Gilmer | 33,327 | 10% |
| Glascock | 3,008 | 14% |
| Glynn | 86,540 | 13% |
| Gordon | 60,765 | 12% |
| Grady | 26,271 | 18% |
| Greene | 21,091 | 11% |
| Gwinnett | 1,003,869 | 9% |
| Habersham | 49,665 | 9% |
| Hall | 221,745 | 8% |
| Hancock | 8,683 | 18% |
| Haralson | 32,404 | 15% |
| Harris | 36,929 | 6% |
| Hart | 28,052 | 14% |
| Heard | 12,119 | 18% |
| Henry | 259,315 | 13% |
| Houston | 174,897 | 12% |
| Irwin | 9,155 | 20% |
| Jackson | 93,825 | 8% |
| Jasper | 17,219 | 12% |
| Jeff Davis | 15,119 | 20% |
| Jefferson | 15,019 | 21% |
| Jenkins | 8,836 | 21% |
| Johnson | 9,178 | 19% |
| Jones | 29,047 | 12% |
| Lamar | 20,690 | 15% |
| Lanier | 10,464 | 18% |
| Laurens | 50,287 | 21% |
| Lee | 34,073 | 12% |
| Liberty | 68,607 | 13% |
| Lincoln | 8,049 | 14% |
| Long | 20,439 | 14% |
| Lowndes | 122,082 | 17% |
| Lumpkin | 36,016 | 8% |
| Macon | 21,764 | 10% |
| Madison | 11,800 | 34% |
| Marion | 11,831 | 14% |
| McDuffie | 32,771 | 13% |
| McIntosh | 7,635 | 25% |
| Meriwether | 21,439 | 19% |
| Miller | 5,824 | 19% |
| Mitchell | 20,329 | 25% |
| Monroe | 31,437 | 10% |
| Montgomery | 8,566 | 17% |
| Morgan | 21,940 | 11% |
| Murray | 41,316 | 16% |
| Muscogee | 201,830 | 19% |
| Newton | 124,010 | 17% |
| Oconee | 44,751 | 3% |
| Oglethorpe | 16,172 | 12% |
| Paulding | 188,549 | 9% |
| Peach | 29,213 | 17% |
| Pickens | 36,580 | 9% |
| Pierce | 20,669 | 17% |
| Pike | 20,669 | 9% |
| Polk | 44,610 | 17% |
| Pulaski | 10,180 | 17% |
| Putnam | 23,383 | 13% |
| Quitman | 2,323 | 27% |
| Rabun | 17,711 | 9% |
| Randolph | 6,085 | 31% |
| Richmond | 206,303 | 20% |
| Rockdale | 97,610 | 15% |
| Schley | 4,503 | 16% |
| Screven | 14,325 | 21% |
| Seminole | 9,274 | 21% |
| Spalding | 70,292 | 19% |
| Stephens | 27,498 | 16% |
| Stewart | 4,809 | 20% |
| Sumter | 28,972 | 27% |
| Talbot | 5,755 | 22% |
| Taliaferro | 1,620 | 19% |
| Tattnall | 24,275 | 16% |
| Taylor | 7,783 | 21% |
| Telfair | 11,000 | 24% |
| Terrell | 8,698 | 28% |
| Thomas | 46,054 | 18% |
| Tift | 41,708 | 21% |
| Toombs | 27,488 | 22% |
| Towns | 13,184 | 7% |
| Treutlen | 6,420 | 24% |
| Troup | 71,513 | 18% |
| Turner | 9,023 | 25% |
| Twiggs | 7,728 | 21% |
| Union | 27,601 | 7% |
| Upson | 28,358 | 21% |
| Walker | 69,340 | 14% |
| Walton | 109,792 | 11% |
| Ware | 36,222 | 23% |
| Warren | 5,148 | 26% |
| Washington | 19,834 | 18% |
| Wayne | 32,132 | 18% |
| Webster | 2,315 | 20% |
| Wheeler | 7,076 | 16% |
| White | 29,668 | 10% |
| Whitfield | 105,070 | 12% |
| Wilcox | 8,904 | 17% |
| Wilkes | 9,567 | 19% |
| Wilkinson | 8,667 | 20% |
| Worth | 20,262 | 19% |
| Georgia | 11,180,878 | 13% |
Endnotes
[1] Ratcliffe, C., & McKernan, S. M. (2010, April). How much does SNAP reduce food insecurity? US Department of Agriculture, Economic Research Service. https://www.ers.usda.gov/publications/pub-details/?pubid=84335#:~:text=The%20results%20suggest%20that%20receiving,of%20reducing%20food%2Drelated%20hardshipCarlson, S., & Keith-Jennings, B. (2018, January 17). SNAP is linked with improved nutritional outcomes and lower health care costs. Center on Budget and Policy Priorities. https://www.cbpp.org/research/food-assistance/snap-is-linked-with-improved-nutritional-outcomes-and-lower-health-care; Cheyne, A., & Vollinger, E. (2022, April 22). New data underscore importance of SNAP benefit redemptions during covid-19. Food Research & Action Center. https://frac.org/blog/new-data-snap-benefit-redemptions; Center on Budget and Policy Priorities. (2018, December 4). Workers from a wide array of occupations use SNAP. https://www.cbpp.org/research/food-assistance/workers-from-a-wide-array-of-occupations-use-snap
[2] US Department of Agriculture, Food and Nutrition Service. (2024, August 4). SNAP. Fiscal Year 2025 Cost-of-Living Adjustments. https://fns-prod.azureedge.us/sites/default/files/resource-files/snap-cola-fy25.pdf.
[3] Georgia Divisions of Family and Children Services. 2023, June. Categorical eligibility. Food Stamp (SNAP) Policy Manual. http://odis.dhs.state.ga.us/ViewDocument.aspx?docId=4000837&amp%3Bamp%3Bamp%3BverId=1. TANF Community Outreach Services (TCOS) provides information and referral services to low-income support programs.
[4] US Department of Agriculture, Food and Nutrition Service. SNAP Eligibility.
[5] Under the expanded work requirements, there will be fewer exemptions; they include:
- Clients under 18 or over 64
- Pregnancy;
- A documented disability;
- Participation in a substance use treatment program;
- Considered physically or mentally unfit with verification;
- Living with a child under 14 years old; and
- Caring for an incapacitated adult or a child not living in the home of the client
[6] Pavetti, L. (2018, April 3). Evidence doesn’t support claims of success of TANF work requirements. Center on Budget and Policy Priorities. https://www.cbpp.org/research/evidence-doesnt-support-claims-of-success-of-tanf-work-requirements; Gray, C., Leive, A., Prager, E., Pukelis, K., & Zaki, M. (2023). Employed in a SNAP: The impact of work requirements on program participation and labor supply. American Economic Association Journal, 15(1), 306-341. https://www.aeaweb.org/articles?id=10.1257/pol.20200561; Feng, W. (2021). The effects of changing SNAP work requirement on the health and employment outcomes of able-bodied adults without dependents. Journal of the American Nutrition Association, 41(3), 281-290. https://doi.org/10.1080/07315724.2021.1879692; Han, J. (2022). The impact of SNAP work requirements on labor supply. Labour Economics, 74. https://doi.org/10.1016/j.labeco.2021.102089; Ku, L., Brantley, E., & Pillai, D. (2019). The effects of SNAP work requirements in reducing participation and benefits from 2013 to 2017. American Journal of Public Health, 109(10), 1446-1451. https://ajph.aphapublications.org/doi/abs/10.2105/AJPH.2019.305232#:~:text=Expansions%20of%20work%20requirements%20caused%20about%20600%E2%80%89000%20participants,after%20work%20requirements%20were%20imposed.%20Public%20Health%20Implications; Stacy, B., Scherpf, E., & Jo, Y. (2018, December 14). The impact of SNAP work requirements. working paper, https://www.aeaweb.org/conference/2019/preliminary/paper/Z8ZhzBZt
[7] U.S. Health and Human Service, Administration for Strategic Preparedness & Response (2023, February 9). Renewal of the determination that a public health emergency exists. https://aspr.hhs.gov/legal/PHE/Pages/COVID19-9Feb2023.aspx.
[8] GBPI analysis of the Department of Human Services, Division of Family and Children Services SNAP ABAWD caseload data.
[9] Georgia Department of Human Services, Divisions of Family and Children Services June 2023 data.
[10] Center on Budget and Policy Priorities. (2025, January 21). Georgia: Supplemental Nutrition Assistance Program. https://www.cbpp.org/sites/default/files/atoms/files/snap_factsheet_georgia.pdf
[11] Altman, H., Broder, T., & D’Avanzo, B. (2025, July 8). Policy brief: The anti-immigrant policies in Trump’s final “Big Beautiful Bill,” explained, restrictions on immigrants’ health and nutrition. National Immigration Law Center. https://www.nilc.org/resources/the-anti-immigrant-policies-in-trumps-final-big-beautiful-bill-explained/
[12] Data from Georgia Divisions of Family and Children Services.
[13] Error rates for a given year are released in the following year. For example, the USDA released the error rates for federal fiscal year 2024 in June 2025.
[14] One Big Beautiful Bill, Title 1 U.S.C. § section 10105 (2025).
This provision was specifically included to help gain the vote of the one senator from Alaska. See: Badger, E. (2025, July 2). Republicans want to cut food stamp errors. Their bill could backfire. The New York Times. https://www.nytimes.com/2025/07/02/upshot/republicans-food-aid-alaska.html.
[15] U.S. Department of Agriculture’s Food and Nutrition Service. (2025, June 30). Supplemental Nutrition Assistance Program: Payment error rates fiscal year 2024. https://fns-prod.azureedge.us/sites/default/files/resource-files/snap-fy24QC-PER.pdf.
[16] Feeding America. (2025, May). Food insecurity among the overall (all ages) population in Georgia. https://map.feedingamerica.org/county/2023/overall/georgia.
[17] US Department of Agriculture, Economic Research Service. (2022, October 17). Definitions of food security. https://www.ers.usda.gov/topics/food-nutrition-assistance/food-security-in-the-u-s/definitions-of-food-security/.
[18] Feeding America. (2025, May). Food insecurity among the overall (all ages) population in Georgia. https://map.feedingamerica.org/county/2023/overall/georgia.
[19] Ratcliffe, C., & McKernan, S. M. (2010, April). How much does SNAP reduce food insecurity? US Department of Agriculture, Economic Research Service. https://www.ers.usda.gov/publications/pub-details/?pubid=84335#:~:text=The%20results%20suggest%20that%20receiving,of%20reducing%20food%2Drelated%20hardship.
[20] Mabli, J., Ohls, J., Dragoset, L., Castner, L., & Santos, B. (2013). Measuring the effect of Supplemental Nutrition Assistance Program (SNAP) participation on food security. US Department of Agriculture, Food and Nutrition Service. https://www.fns.usda.gov/measuring-effect-snap-participation-food-security-0.
[21] Cook, C., Norris, S., Sánchez, A. & Scavette, A. (2024). Understanding SNAP’s role. Federal Reserve Bank of Richmond. https://www.richmondfed.org/publications/research/econ_focus/2024/q1-q2/district_digest.
[22] Ganong, P. & Liebman, J. (2018). The decline, rebound, and further rise in SNAP enrollment: Disentangling business cycle fluctuations and policy changes. American Economic Journal: Economic Policy 10(4): 153–76. https://www.aeaweb.org/articles?id=10.1257/pol.20140016.
[23] Nchako, C. (2025, January 21). A closer look at who benefits from SNAP: State-by-state fact sheets. Center on Budget and Policy Priorities. https://www.cbpp.org/research/food-assistance/a-closer-look-at-who-benefits-from-snap-state-by-state-fact-sheets#Georgia.
[24] Srinivasan, M., & Pooler, J. (published online 2018, January 10). Cost-related medication nonadherence for older adults participating in SNAP, 2013–2015. American Journal of Public Health. http://ajph.aphapublications.org/doi/10.2105/AJPH.2017.304176.
[25] Berkowitz, S., Seligman, H., & Basu, S. (2017). Impact of food insecurity and SNAP participation on healthcare utilization and expenditures. University of Kentucky Center for Poverty Research Discussion Paper Series, DP2017-02, http://uknowledge.uky.edu/cgi/viewcontent.cgi?article=1105&context=ukcpr_papers.
[26] Hoynes, H., Schanzenbach, D., & Almond, D. (2012, November). Long run impacts of childhood access to the safety net. National Bureau of Economic Research. http://www.nber.org/papers/w18535.
[27] US Department of Agriculture, Food and Nutrition Service. (2025, May 22). SNAP retailer locator data. U.S. Department of Agriculture. https://usda-snap-retailers-usda-fns.hub.arcgis.com/datasets/USDA-FNS::snap-retailer-location-data/explore?location=32.614869%2C-83.707703%2C8.22.
[28] Data from the Georgia Department of Human Services, Division of Family and Children Services.
[29] Canning, P., & Mentzer Morrison, R. (2019, July 18). Quantifying the impact of SNAP benefits on the U.S. economy and jobs. USDA, Economic Research Service. https://www.ers.usda.gov/amber-waves/2019/july/quantifying-the-impact-of-snap-benefits-on-the-us-economy-and-jobs/.
[30] Food Research & Action Center. (2023). Table 2. Household SNAP participation in metro, small town, and rural counties, by state, 2017-2021. https://frac.org/maps/snap-state-map/tables/snap-states-tab2.html.