Why a Wealth-Building Agenda for Georgia Women?
Building and growing the wealth of women is a necessary concern for Georgia lawmakers striving to keep the state growing and prospering. Women are a majority of Georgia’s adult population[1] and are the primary or co-breadwinners in more than half of Georgia households with children.[2] Women help shoulder the weight of well-being for Georgia’s families, businesses and the economy as a whole now more than ever.
Georgia can do much more to boost women’s assets. The typical household headed by a single woman in Georgia has about $10,450 in wealth. That’s only half the net worth of women nationally and only about 42 percent of the wealth of households headed by single men in Georgia. The gap is even starker for women of color.

Depressed levels of wealth mean fewer savings to buy a home, start a business, cover unexpected financial emergencies or invest in a child’s education. Wealth is essential to the long-term economic security of families. Income is a more common measure of economic status, but it focuses more on year to year changes.
Wealth is a measure of a household’s assets minus its liabilities. Assets include cash, bank accounts, stocks, bonds and equity in a home, business, and other real estate. Liabilities are debts, including mortgages, auto loans, student loans and credit card debt.
Wealth provides four important benefits for families that spread to communities and the economy as a whole:
- It is a reservoir of resources that families can tap during financial emergencies to pay for a large and unexpected expense, a repair or living costs during a temporary job loss. This is more important than ever as jobs are less stable and provide fewer benefits than they once did.[3] In times of economic instability due to job loss or reduced work hours, access to wealth can help entire families weather the storm and get back on their feet quickly.
- It is a nest egg people and families can leverage for other investments, including a home or business. More new businesses lead to higher productivity, wage growth and quality of life for entire communities.[4] Ensuring women have both sufficient opportunities and means to start new businesses and see them succeed at comparable rates as men holds importance for the future health of the state’s economy.
- Wealth can also be passed to future generations, providing them with money needed to finance education, homes or other wealth-generating tools.[5] Savings, home equity and business profits can be used by families to put their children and the next generation on a path to sustained, generational economic security and upward mobility. Finding ways to boost wealth for women and families today is a down payment on success for Georgians down the road.
- Wealth is linked to better outcomes for children. Children of single mothers with some assets are more likely to graduate high school and earn higher grades, even accounting for income, mother’s education and expectations for their children’s education, and other factors that predict children’s achievement.[6]
Georgia stands to gain by increasing the wealth of its women. It can be done through smart, targeted policy reforms. The wealth gap is attributable to several causes that require diverse solutions. Women earn less than men, leaving them with less to save and invest. Women spend a disproportionate amount of time on caregiving, which drains their wealth. Women tend to pay higher interest rates to borrow money, while less purchasing power limits women’s home equity. Additionally, women own fewer and smaller businesses than men.
This report offers three strategic policy solutions Georgia can pursue to begin to address some of these underlying causes and strengthen the financial foundation for the state’s women. Georgia can:
- Establish paid family and medical leave on the state and local levels
- Support state and local housing trust funds
- Bolster women’s entrepreneurship through technical assistance and contracting goals
More can be done to close the gender wealth gap in Georgia. These recommendations build on policy proposals already under discussion in the state and lay the groundwork for future wealth-building action.
A Focus on Single Women
The best way to measure the gender wealth gap is to compare the wealth of single women to single men because wealth held by most married couples is shared.[7] This report’s references to the gender wealth gap mean the difference between the wealth of single women and single men.
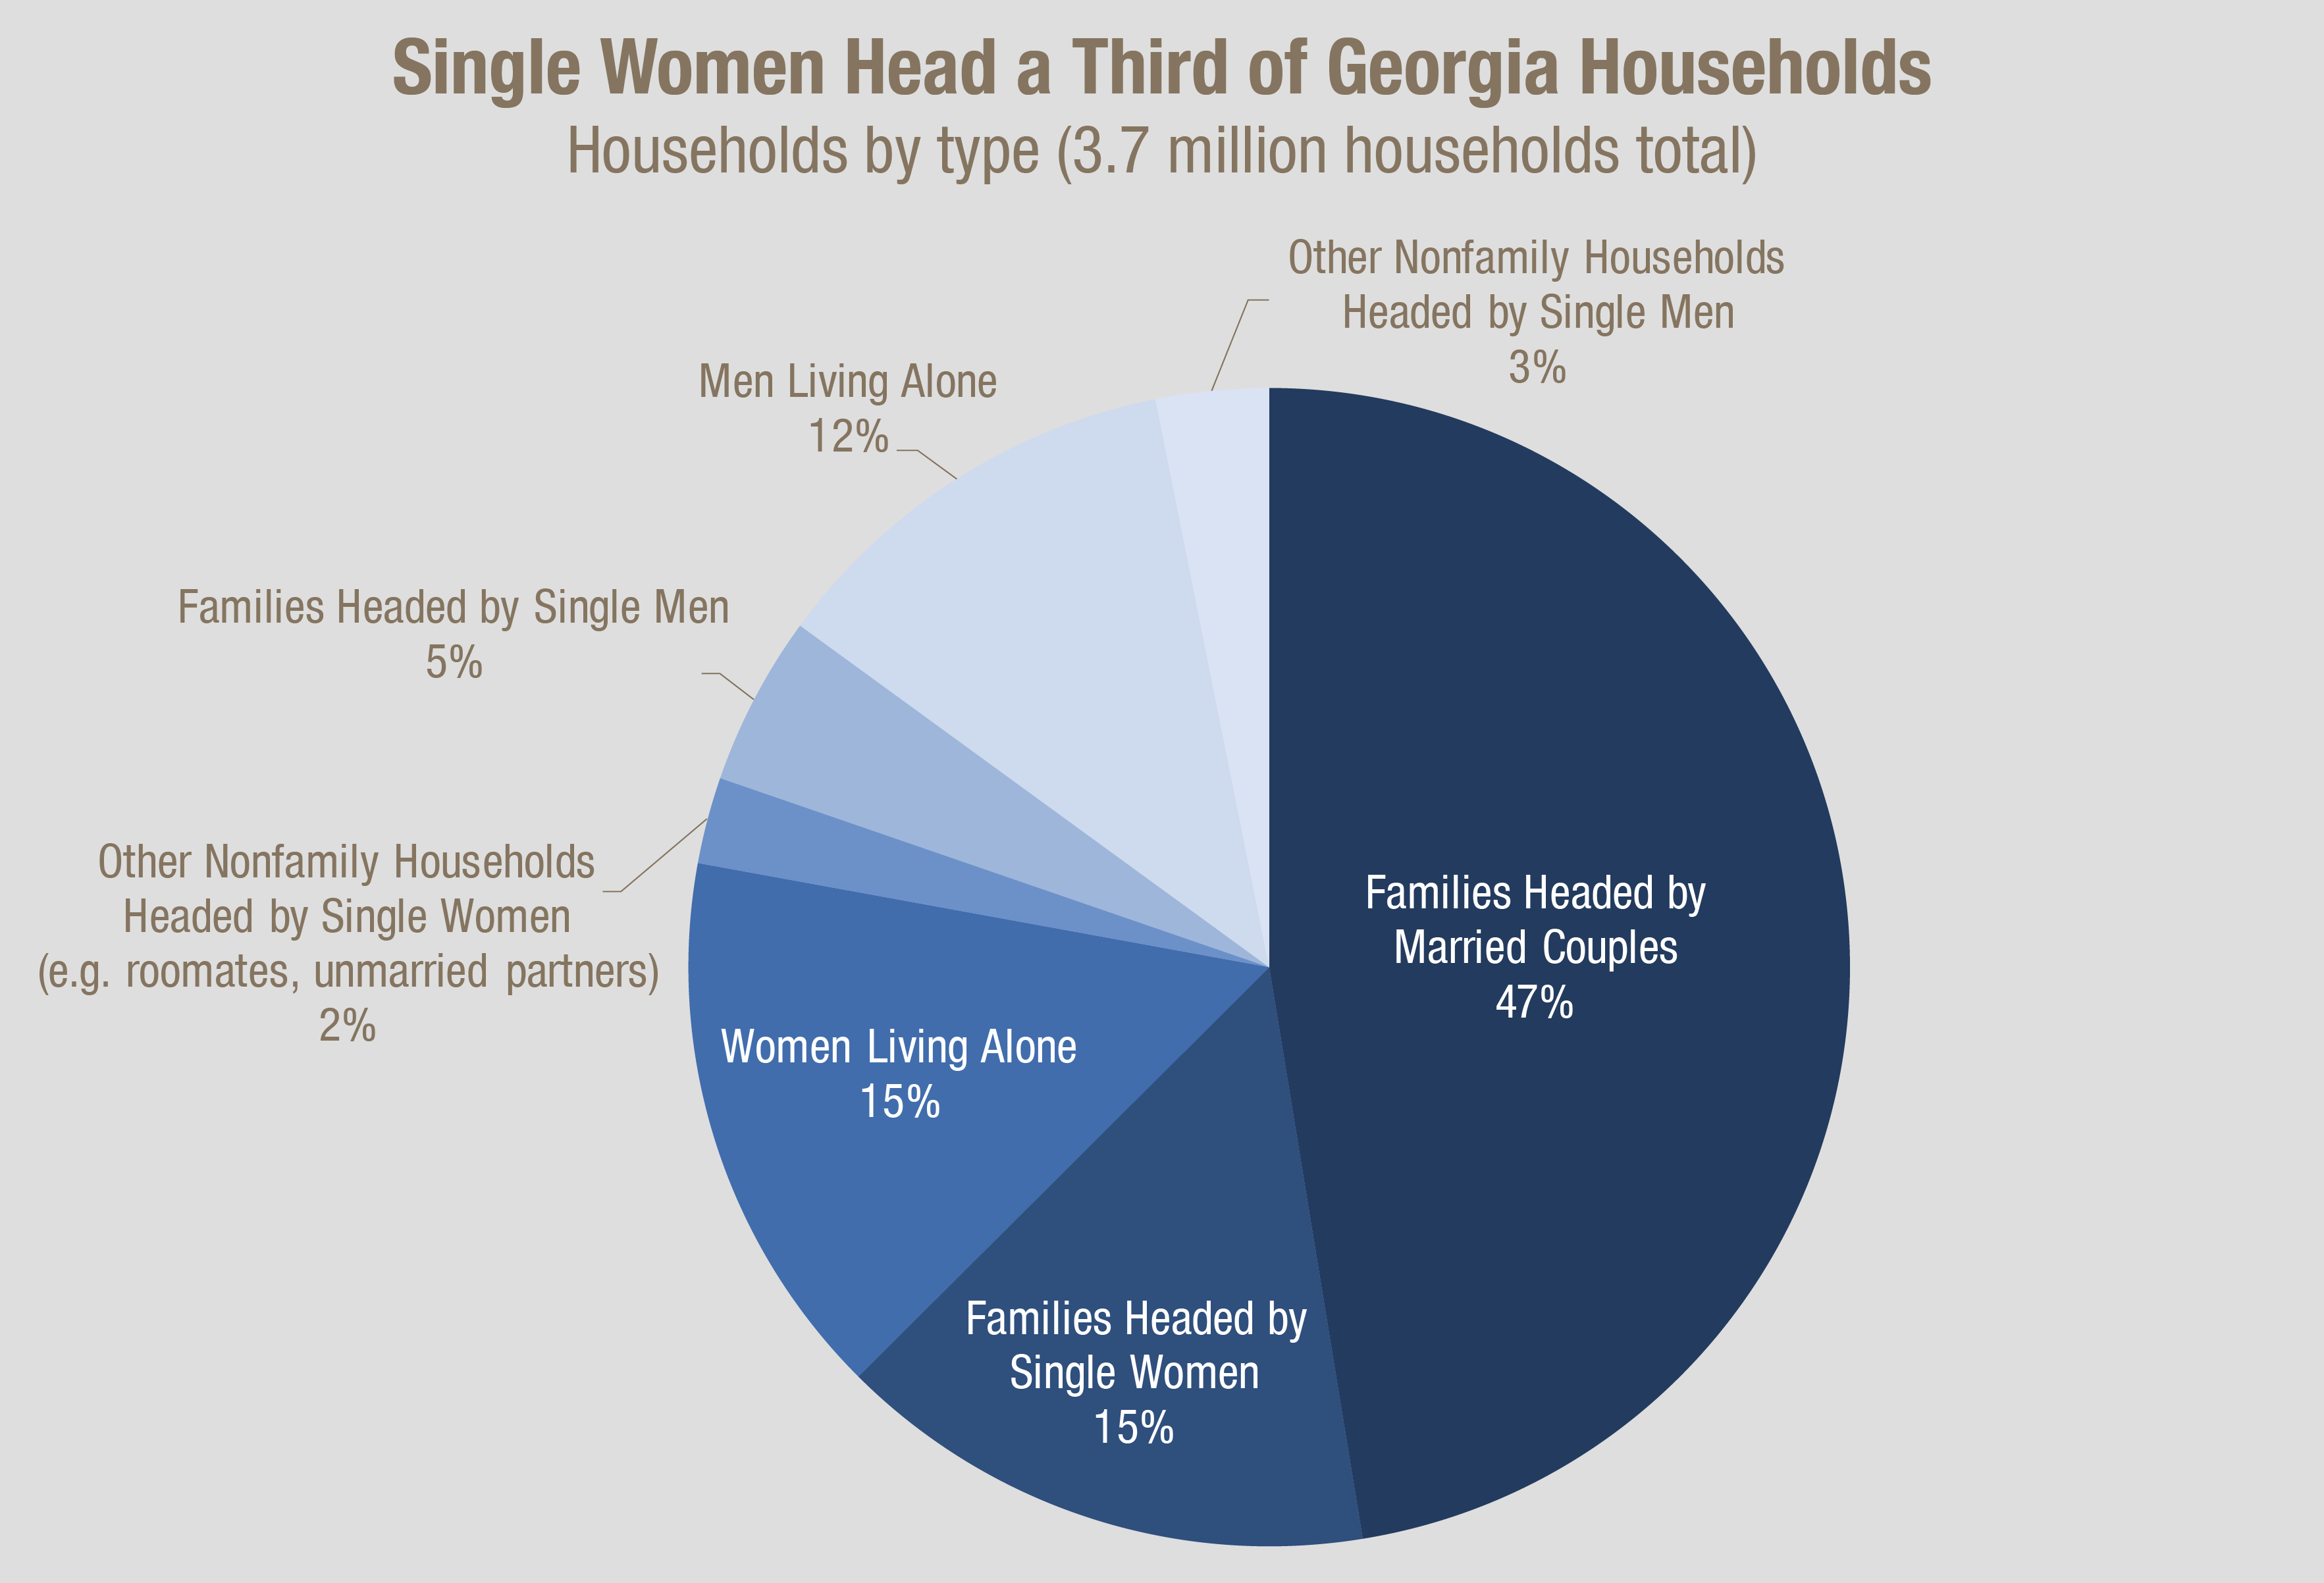
That focus still includes a large portion of Georgia’s population. Single women head one in three Georgia households. Households headed by single women include nearly 556,000 families headed by single mothers.[8] Another 567,000 households are women living alone.
Wealth-building activities for single women are a needed focus because marriage is not the only solution for bolstering women’s wealth. Women now spend half or more of their lives single.[9] Just 50 percent of marriages in the United States survive. Marriage rates declined for decades before 2015, when the latest data indicated that rates might be stabilizing.[10] Even when women earning low incomes do get married, they are less likely to gain from the wealth-enhancing benefits of marriage in the same way that women with higher incomes do.[11]
The solutions discussed in this report will disproportionately benefit single women because many do not share in the wealth of a spouse. Still, the solutions offered in this report can increase the wealth of everyone.
Shrinking Both Racial and Gender Wealth Gaps Strengthens Georgia
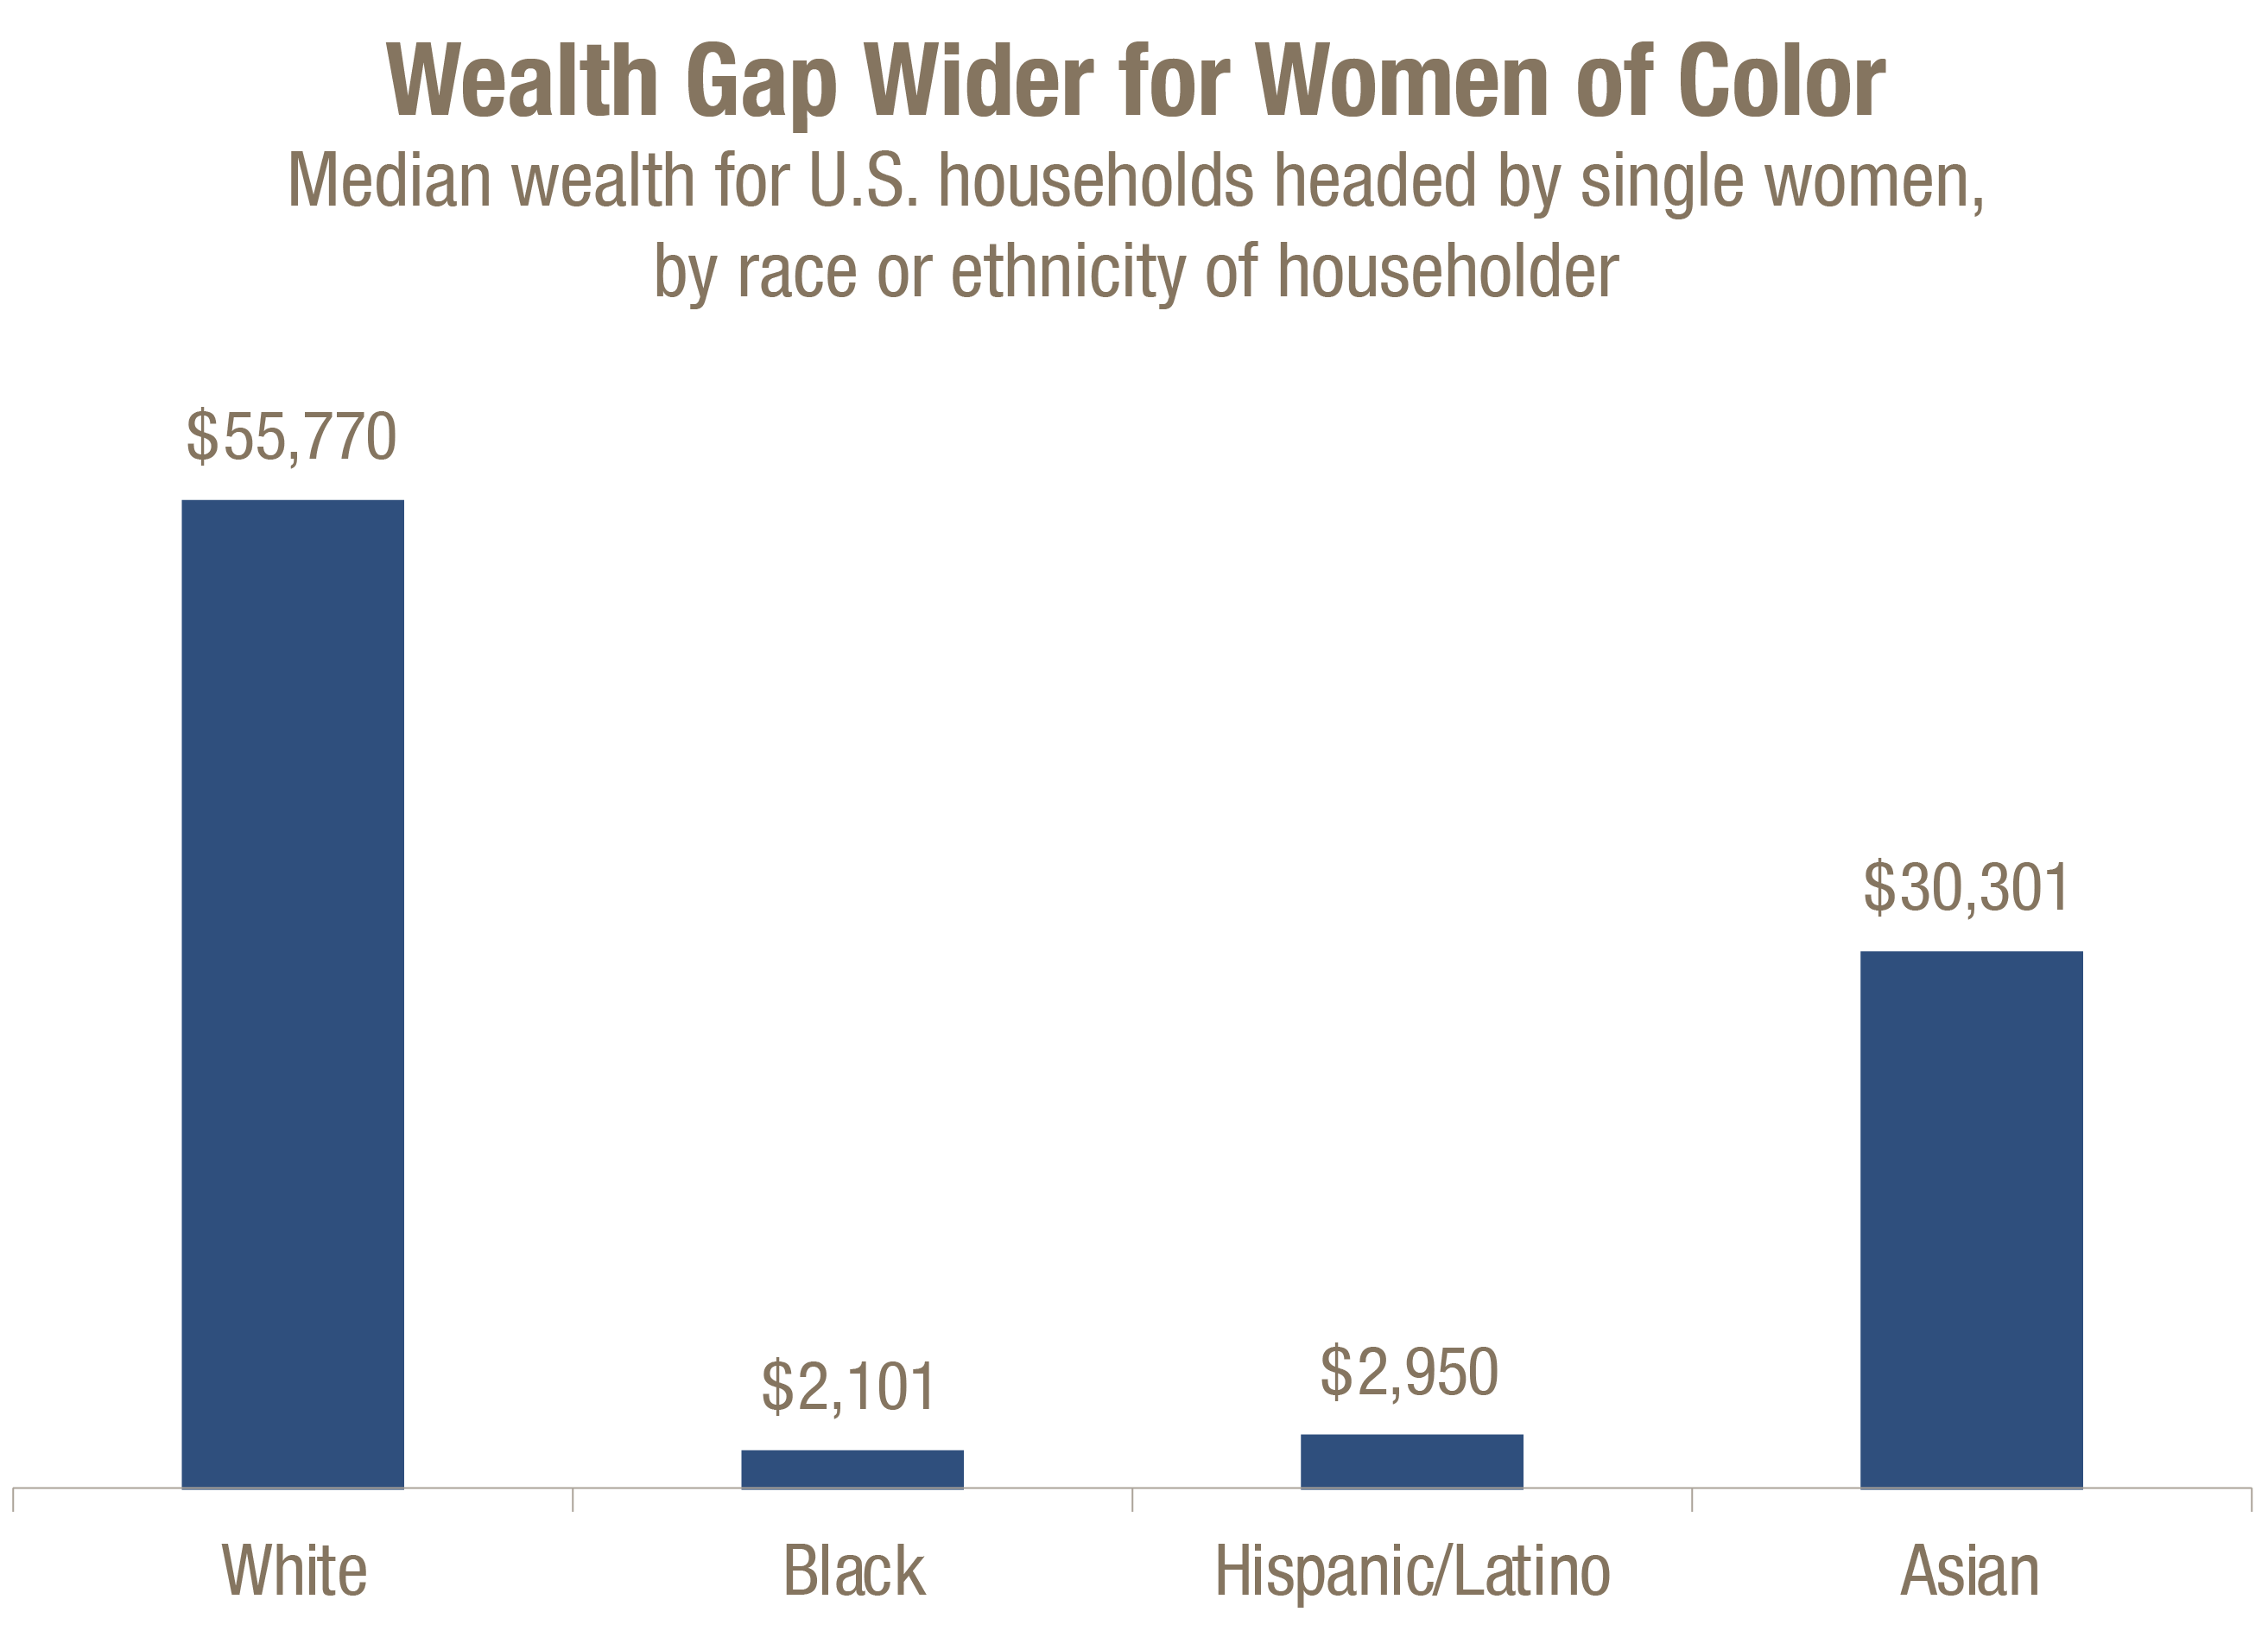
The gender wealth gap is even starker for women of color. The typical wealth for a U.S. household headed by a single white woman is $55,770. This compares to $2,101 for households headed by a single black woman, $2,950 for those headed by single Hispanic woman, and $30,301 for those headed by a single Asian woman.
Building wealth for families of color in particular is important for Georgia’s future. People of color will make up the majority of the state’s population by 2030. Meanwhile, measures that influence disparities continue to exist between Georgia’s black, Hispanic and white residents in high school graduation rates[12], college completion[13], earnings[14] and other measures.
People of color will make up the majority of the Georgia’s population by 2030.
– PolicyLink
For example, nearly half of Georgia’s working families with at least one parent of color earn low incomes compared to 36 percent of all working families in the state.[15] A family of three with one child in 2015 bringing in $38,156 per year was considered low income.
Ending these disparities is crucial to the long-term strength and sustainability of Georgia’s economy. If Georgia eliminated racial disparities in income alone, the state could add nearly $87 billion to its economy.[16]
“When families of equal wealth are compared, black-white racial disparities in rates of college graduation, employment, work hours and welfare usage disappear.”
– Dalton Conley, Princeton University[17]
“When families of equal wealth are compared, black-white racial disparities in rates of college graduation, employment, work hours and welfare usage disappear.” –
Research shows tackling the racial wealth gap in particular might be the key to eliminating racial disparities. When Hispanic, black, Asian, and white students of similar wealth are compared, differences in 4-year college attendance disappear, research shows.[18] This underscores the importance of closing the wealth gap so that Georgians get a fair chance to reach their potential and make their maximum contribution to the state’s economy.
Wealth Gap Has Many Causes, Needs Diverse Solutions
Several barriers will need to be cleared to increase wealth for Georgia women. Women in the state earn less than men on average despite their education and abilities. These lower earnings leave women with less to save and invest. Women are also more likely to take time away from the workforce or reduce work hours to care for relatives. Also, while single women in Georgia are slightly more likely to own homes than single men, national statistics show women are also more likely to receive subprime mortgages that drain their wealth. Women also own fewer businesses than men with lower revenues.
When women earn less than men it leaves them with fewer resources to build wealth through saving and investing. The gender wage gap typically translates into $800,000 in lost earnings for women in the U.S. over a lifetime[19], a huge loss that might be used for saving, investing and building wealth.
Georgia women working full time earn an average of $38,278 per year, compared to $46,712 for men with full-time jobs. Earnings for Georgia women working full time also lag behind the national average of $40,626 per year.[20] The earnings gap is even wider for women of color. Black women in Georgia, for example, earn only 66 percent of what white men do, whereas white women earn 80 percent as much as white men.[21] That racial gap in earnings adds up over a lifetime. Among single early baby boomers in the U.S., white men held a median wealth of $109,000 compared to $12,185 for women of color.[22]
This earnings gap between Georgia’s men and women is detailed in comprehensive terms in the 2016 GBPI report Women Working Ahead: An Economic Opportunity Agenda for Georgia Women. It explores the factors that account for the gender wage gap, shows disparities by race and ethnicity and prescribes policy solutions to close the gap. Those include a higher minimum wage and more state investment in child care. Further details on that report and those policy solutions are available at www.gbpi.org.
The remainder of this report will explore three other key reasons for the gender wealth gap and offer specific policy solutions to fix them.
Caregiving: Disproportionate Responsibilities Drain Women’s Wealth
Women typically take on more caregiving responsibility for older people, children, and people with disabilities, which widens the gender earnings and wealth gaps.[23] When women are pressed to reduce their work hours or leave the workforce to have children or care for relatives, they lose income and a critical opportunity to save and build wealth. And because about 86 percent of workers lack access to paid family leave, women in many cases drain existing sources of household wealth to meet their own basic needs while they provide care to others.[24]
Women are more likely than men to leave the workforce to take care of their families. Women across the country ages 25 to 54 who are not in the workforce cite home responsibilities as the top reason for not working and are 12 times more likely than men to say that is the reason they are not working.[25]

Women care for people with disabilities and older people, as well as their own children. More than 15 percent of women in Georgia live with a person with a disability.[26]
Baby boomers who care for their parents are nearly twice as likely to be women, according to a study. More than one-third of caregivers who assist older adults leave the workforce or reduce hours worked due to caregiving demands. Women are more likely to leave their jobs than to reduce their hours.[27]
Federal law provides most employees with an option to take unpaid leave to care for themselves, a spouse, parent or child, but about 37 percent of people who take this unpaid leave must dip into savings set aside for another purpose.[28]
The gender gap between the labor force participation rates is a good illustration of the toll unpaid care work can take. Georgia is one of 20 states with the widest gap between labor force participation rates for mothers and fathers with children under six.[29] A sizable gap exists between men and women’s total labor force participation rates. Nearly 69 percent of Georgia men participate in the workforce compared to about 57 percent of Georgia women.[30]
Reduced labor force participation for women is a drain on their wealth. A comparison of the earnings of men and women between the ages of 26 and 59 over 15 years shows women’s part-time work and years out of the labor force led to an earnings gap of $449,101 less than men, according to a study.[31] Other means of job-related wealth-building likely suffered too, including Social Security contributions, payments to retirement plans and tax credits for workers.
For every year a woman is a full-time caregiver she has to work five extra years to make up for the lost income and retirement benefits, another study says.[32] Women aged 50 and over who leave the workforce to care for their parents lose an estimated $131,351 in Social Security benefits.[33]
This loss of income is especially critical because women’s wages are essential to family economic security. Women are breadwinners in more than half of Georgia households with children.[34] Women breadwinners include nearly 556,000 single mothers who may need to take time away from work to care for themselves, an older parent or a sibling with a disability.
Paid leave could offer some relief but women are more likely to work in low-wage service sector or part-time jobs that do not offer paid sick time off and family leave.[35] About 19 percent of Georgia women are employed in service jobs compared to 14 percent of Georgia men.[36] More than one in four Georgia women work part-time compared to fewer than one in six Georgia men.[37]
Women of Color More Likely to Care for Others and Work, Less Likely to Have Access to Paid Leave
Women of color are more likely to combine caregiving responsibilities with work. Black families in particular are much more likely to rely on women’s earnings for at least 40 percent of family income. Women of color are also less likely to hold jobs that offer paid family leave. All of these factors combine to widen the wealth gap for women of color.The disparate caregiving responsibilities of women of color include taking care of both older adults and children. About 15 percent of caregivers age 60 and older who look after their parents are black, according to a study of baby boomers in the U.S. (At the time of the study black people represented about 9 percent of the population in that age group.)[38]
Nationally, black mothers with young children participate in the labor force at higher rates than their counterparts and are therefore more likely to struggle to balance caregiving responsibilities. About four out of five black mothers with children under six years old participate in the workforce compared to 68 percent of white mothers.[39]
Black families are more likely to depend on women’s earnings, which may account for higher rates of black mothers in the labor force. Nearly eight in 10 households led by black people in Georgia have mothers as breadwinners who are either the sole earner or earn at least 40 percent of household income. Even in married households, black women are still breadwinners at higher rates than white women or women of other races.[40]
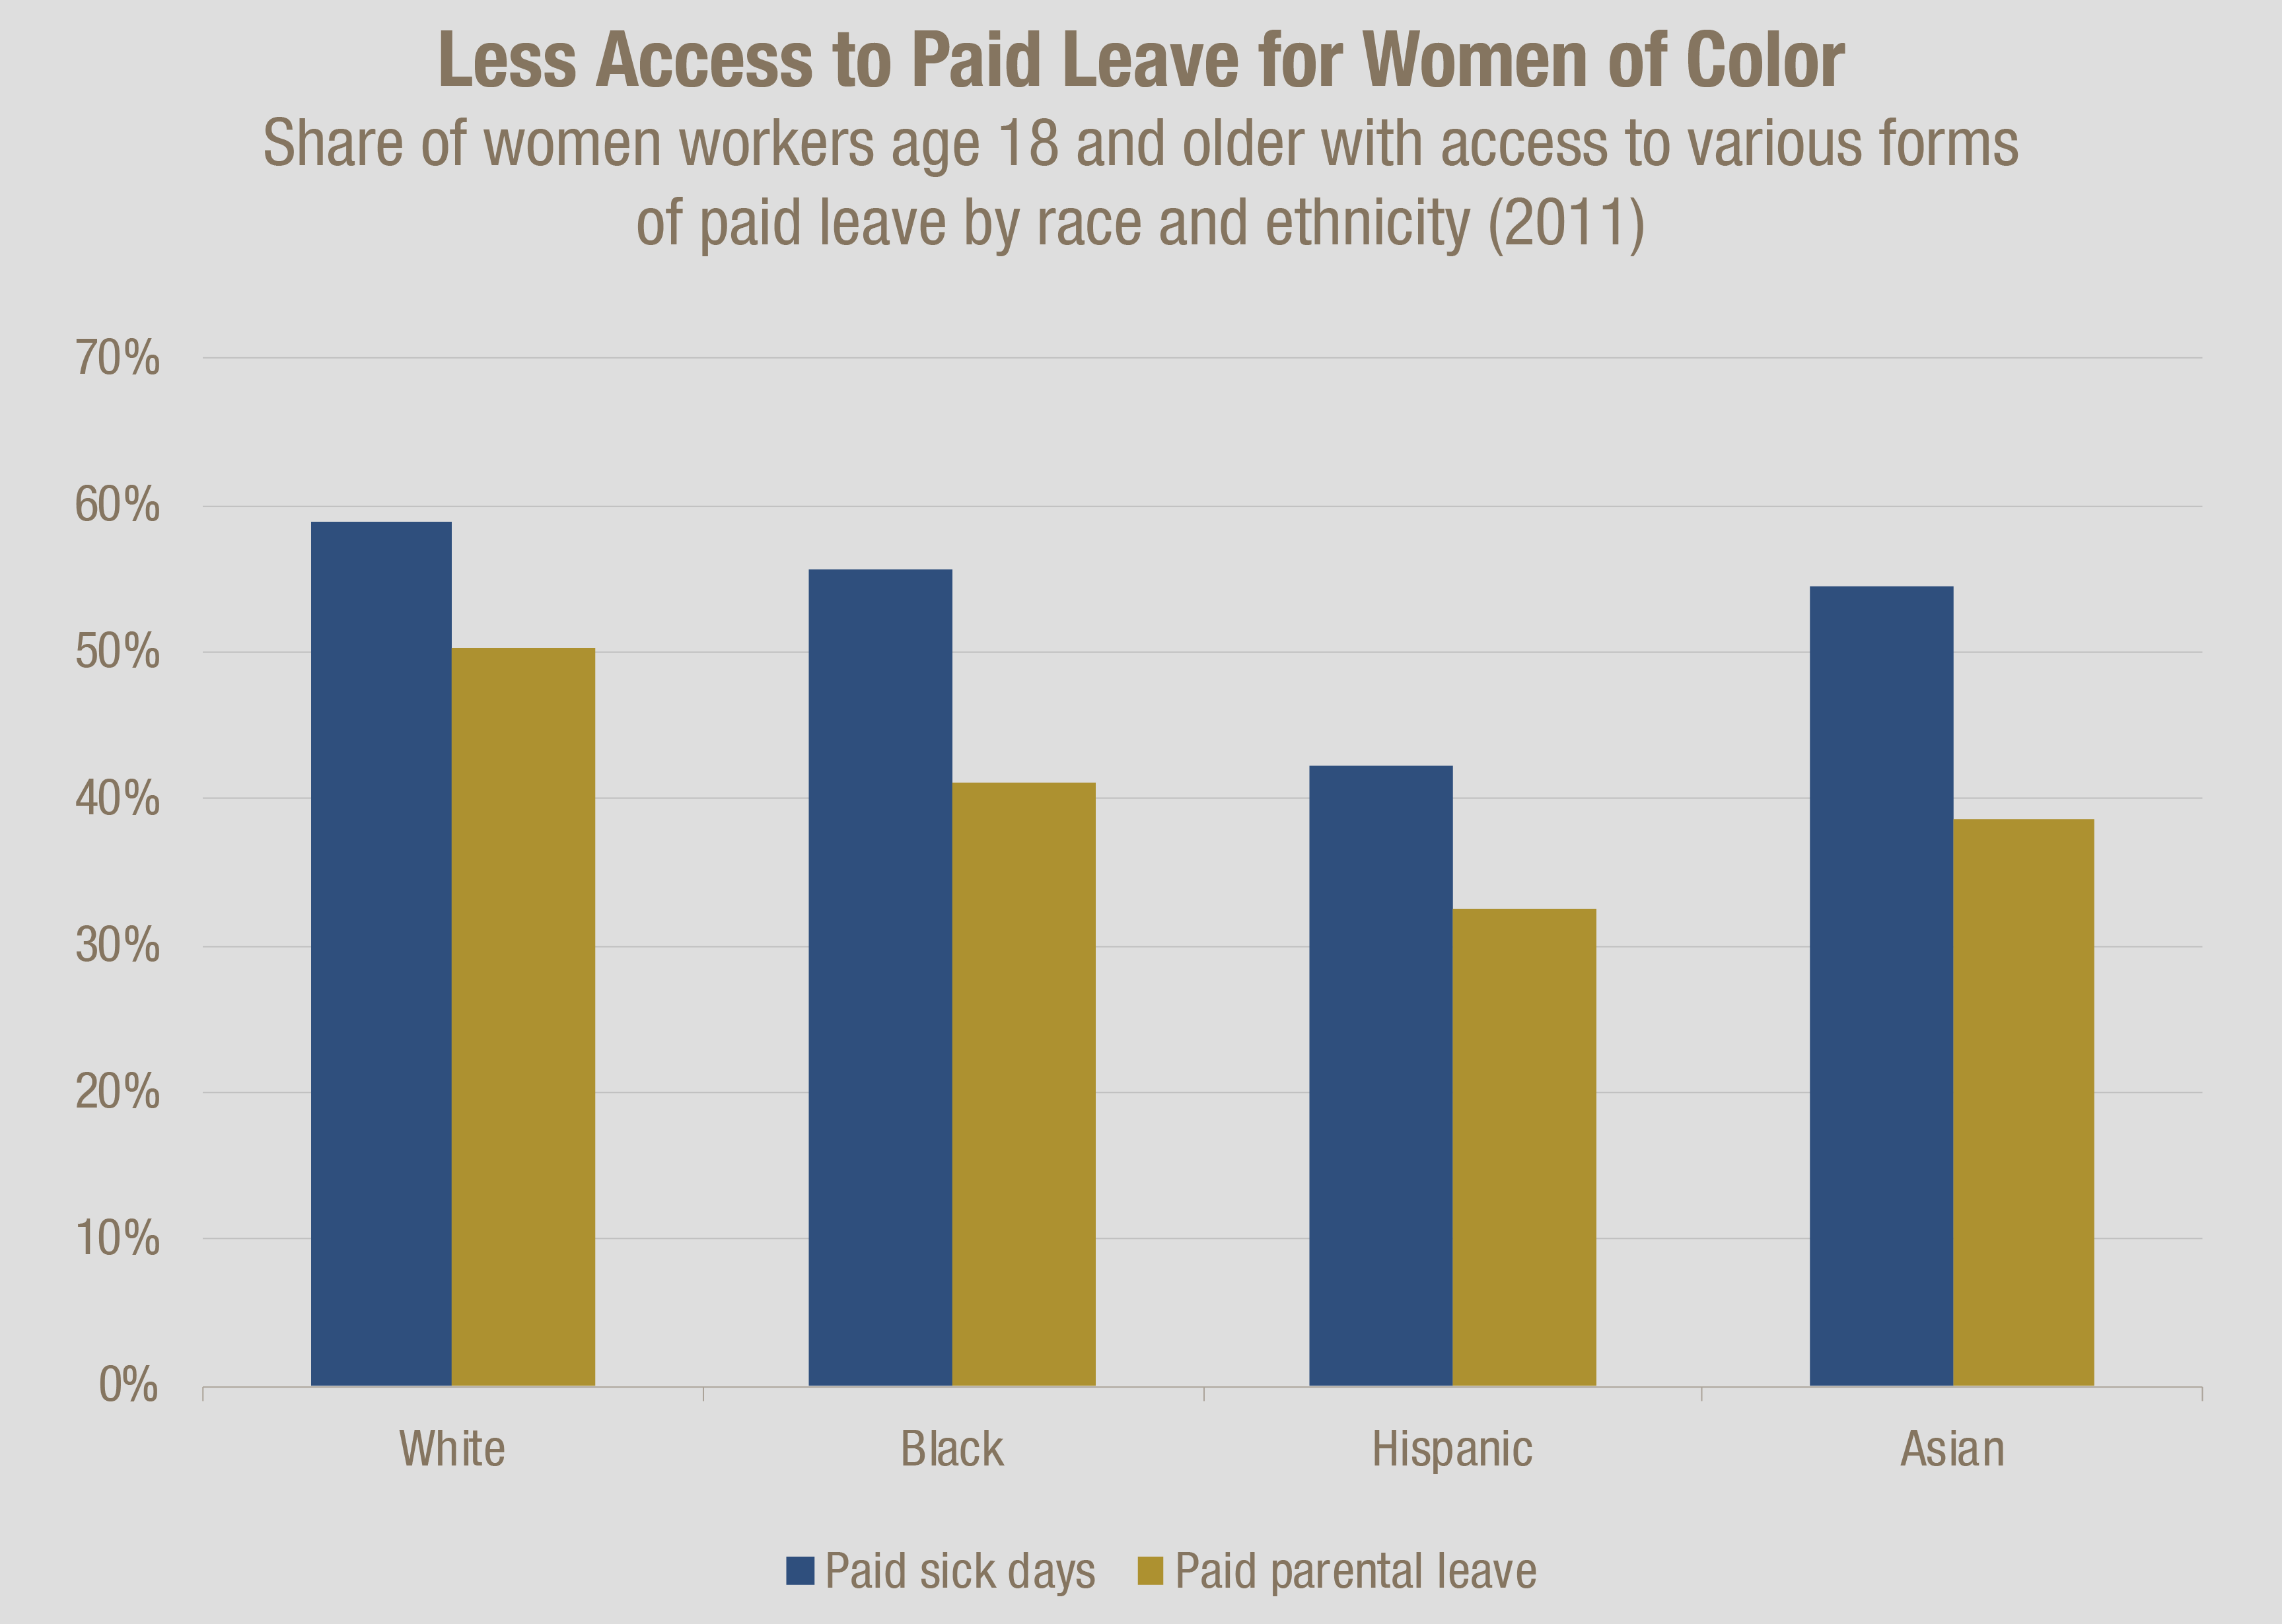
Women of color are less likely to get paid family leave through work. Women of color are more likely to work in low-wage, low-quality jobs without these benefits. At least one in five Asian, black and Hispanic women in Georgia works in the service industry compared to only 16 percent of white women.[41] Workers in service occupations are least likely to get paid leave through work.[42]
Women of color will increasingly need access to paid family leave in the future as people of color are expected to grow beyond today’s 47 percent of Georgia’s workforce[43] in both number and share of the population.[44]
Expand Paid Family and Medical Leave to Preserve Assets
Paid family leave helps women and families retain wealth. Paid leave also keeps women connected to the workforce while they balance family responsibilities. Only 14 percent of workers in southern Atlantic states from Delaware to Georgia can get paid family leave.[45]
Five States and Washington D.C. Lead the Way on Family and Medical Leave
By 2020, five states and the District of Columbia will provide a paid family leave option to workers.[46] Advocates in North Carolina, Montana and Wisconsin are campaigning for paid family leave there.[47]
In California, New Jersey, Rhode Island, New York, Washington and Washington, D.C., paid family leave insurance programs provide four to 12 weeks of wage replacement to care for new parents to look after a child, for workers to assist family members with serious health conditions or for workers to tend to their own disability. New York’s law also provides paid leave in the event of a qualifying emergency when a family member is called to active military duty.[48]
In all of these states, employees are either solely responsible for the costs or help to fund paid family leave.[49] Only in Washington, D.C. are employers solely responsible for the costs of the program.
States Providing Paid Family Leave Insurance
| California (CA) |
New Jersey (NJ) |
Rhode Island (RI) |
New York (NY) |
District of Columbia (DC) |
Washington (WA) |
||
| Year Passed | 2002 | 2008 | 2013 | 2016 | 2017 | 2017 | |
| First Year Effective | 2004 | 2009 | 2014 | 2018 | 2020 | 2020 | |
| Typical Support Provided |
|
||||||
| Maximum Weekly Benefit for Family Leave | $1,173 | $633 | $817 | $653[52] | $1,000 | $1,000 | |
| Maximum Length of Family Leave | Six weeks | Six weeks | Four weeks | Eight weeks* | Eight weeks – parental; Six weeks – family care | 12 weeks | |
| Share of Wages paid by Employee | 0.9% | 0.24% of first $33,500 in wages per year, up to $80.40. | 1.2% of first $68,100 in wages | To be determined by state official | N/A | 0.4% | |
| Private Sector Employees Covered? | All | Some | All | Most | Some | All | |
| Public Sector Employees Covered? | Some | Some | Some | Can opt in | No | All | |

State-based family leave helps strengthen women’s economic security and businesses retain workers without requiring burdensome adjustments.
“Women in states with paid family and medical leave programs are less likely than those in other states to receive public assistance or food stamp income following a new child’s arrival, and that is particularly the case among those who used their state’s paid leave program.”
– Center for Women and Work at Rutgers[53]
New mothers with access to paid leave are also more likely to report higher wages in the year after giving birth. This statistic takes into account other factors that may affect wage rates.[54]
Meanwhile, nearly 88 percent of California workers reported returning to their employers after taking paid family leave. The vast majority of California employers report either a positive impact or no effect on employee productivity, profitability and performance years after the implementation of paid family leave.[55]
Fifty-three percent of small businesses and nearly 60 percent of mid-size businesses in New Jersey say they easily adjusted to the paid family law and experienced no ill effects on profitability or performance.[56] Paid family leave helped reduce stress and improve morale among the workers taking leave as well as their co-workers, the businesses reported. Rhode Island businesses in key industries also reported an easy adjustment to the law. The majority of employers in Rhode Island say they support the new law.[57]
States Provide Parental Leave for Own Employees
An intermediate step toward establishing a paid family and medical leave option for most of the residents in a state is to provide some form of benefit to state employees. Illinois, Ohio, and Virginia are examples.
• Illinois provides four weeks of paid parental leave to be used by state employees of either gender after the birth or adoption of a child.
• Ohio also provides four weeks of paid parental leave for state employees of either gender to use after the birth or adoption of a child. Pay is calculated at 70 percent of an employee’s current salary. Employees must also satisfy a two-week unpaid waiting period before using their four weeks of paid leave.
• Virginia, which has a similar population and state workforce as Georgia[58], affords women up to 125 days of maternity leave with either full or partial wage replacement, depending on length of service. Some state workers can take four to five days per year of paid family or personal leave to care for a family member.[59]
Illinois, Ohio, and Virginia provide each of these parental and family leave benefits to state employees in addition to annual and sick leave benefits.[60] For comparison, 68,000 Georgia employees are restricted to use available annual, sick or personal leave for pay while on family and medical leave.[61] Georgia offers state employees a short-term disability insurance policy that women employees can leverage for income if they have a pregnancy-related disability such as back pain or blood clots.[62] Employees are responsible for paying these premiums.[63]
Georgia’s short-term disability insurance is an inadequate substitute for paid family and medical leave. Short-term disability insurance provides just 60 cents on the dollar in wage replacement. It only covers the pregnancy-related disability of a biological birth mother, so fathers and adoptive mothers are left to tap sick leave and other resources to spend time bonding with a new child. Disability insurance does not cover the employee for missing work to care for a family member. Employees are left to use sick leave for that purpose.
Local Governments Pave Way for Georgia to Provide Paid Family Leave
More than 50 local governments nationwide offer paid parental or more inclusive family leave policies for their employees. Local leaders are often offering benefits not available statewide. The cities of Seattle, New York, as well as King County, Wash., established paid family leave policies before their states adopted their own laws.
At least six Georgia local governments offer paid parental leave policies, funding related costs through the city or county budget:
Georgia Local Governments Offer Paid Parental Leave
| Atlanta | Clarkston | Marietta | Warner Robins | Fort Valley | Bibb County | |
| Year Enacted | 2015 | 2016 | 2016 | 2017 | ||
| Employees Covered | Foster, adoptive or birth parents of either sex; spouses, domestic partners | Foster, adoptive or birth parents of either sex | Birth mothers | Birth and adoptive parents | ||
| Pay Provided | Six weeks’ full pay for primary caregivers; Two weeks for non-primary caregivers | Eight weeks at two-thirds salary | Four weeks’ full pay |
|
||
Advocates are campaigning for Houston County to adopt a parental leave policy similar to the one adopted by the cities of Warner Robins, Fort Valley, and by Bibb County.[64]
“I want other women to have [parental leave]. I want other mothers and fathers to have it, and those who adopt to have that opportunity to not have to burn through their savings in order to have that really important time”
– Bibb County Resident Jessica Walden[65]
Expansion of paid parental leave is gaining momentum in Georgia. Private employers with Georgia operations including Racetrac, Ikea, Starbucks, Nordstrom, Bank of America, Coca-Cola, Delta Air Lines are among the firms demonstrating the viability of paid parental leave.[66]
Despite these local successes, too many Georgians are still left without paid family leave. And too many policies do not allow employees to take care of other family members with an illness or a disability. Both Georgia localities and the state can establish this important benefit that helps women preserve wealth and businesses retain workers.
Homeownership: Higher Rates for Home Loans, Smaller Budgets Limit Women’s Wealth
Homeownership is the main way for families to build wealth in the United States. The concentration of women in jobs that lack retirement benefits and the performance of unpaid caregiving at home give women fewer options than men to build wealth outside of homeownership.[67]
More than 47 percent of single women in Georgia own their homes compared to 46 percent of single men.[68] While single women in Georgia are slightly more likely to own their homes than single men, national and local numbers indicate women pay more for their mortgages and that homeownership presents more of a wealth-building opportunity for men.
A greater instance of high-rate, subprime mortgage lending to women is a contributor to their higher mortgage costs. Subprime loans carry unfavorable conditions such as high interest rates. Women also tend to carry weaker credit profiles due to their lower incomes. Even with mortgages of similar size, the loan takes a greater share of women’s lower income.[69]
Women carry weaker credit profiles generally, but evidence shows women pay mortgages more reliably than comparable men. Among women and men with similar credit characteristics, women default on their home loans less often than men. Since the pricing of a mortgage is tied to credit characteristics and not actual performance, women wind up paying more for homeownership relative to actual risk than men do.[70]
The numbers also show homeownership is more profitable for single men than for single women in Georgia. Houses owned by single men carry higher valuations and appreciate quicker than houses owned by single women. Homes owned by single men across the U.S. gained $10,000 more in value since their purchase versus homes owned by single women. The gender income gap also gives women less purchasing power, which has a domino effect on their ability to build wealth through homeownership as quickly as men.[71]
Age is also a drag on the wealth of women homeowners. Women in Georgia and across the U.S. typically live longer than men do.[72] As women age, finding money to make age-friendly home modifications or even make mortgage and other housing-related payments can become more difficult. Older women are more likely to live alone later in life and need expensive long-term care. This too can make the preservation of homeownership and home equity even more difficult.[73]
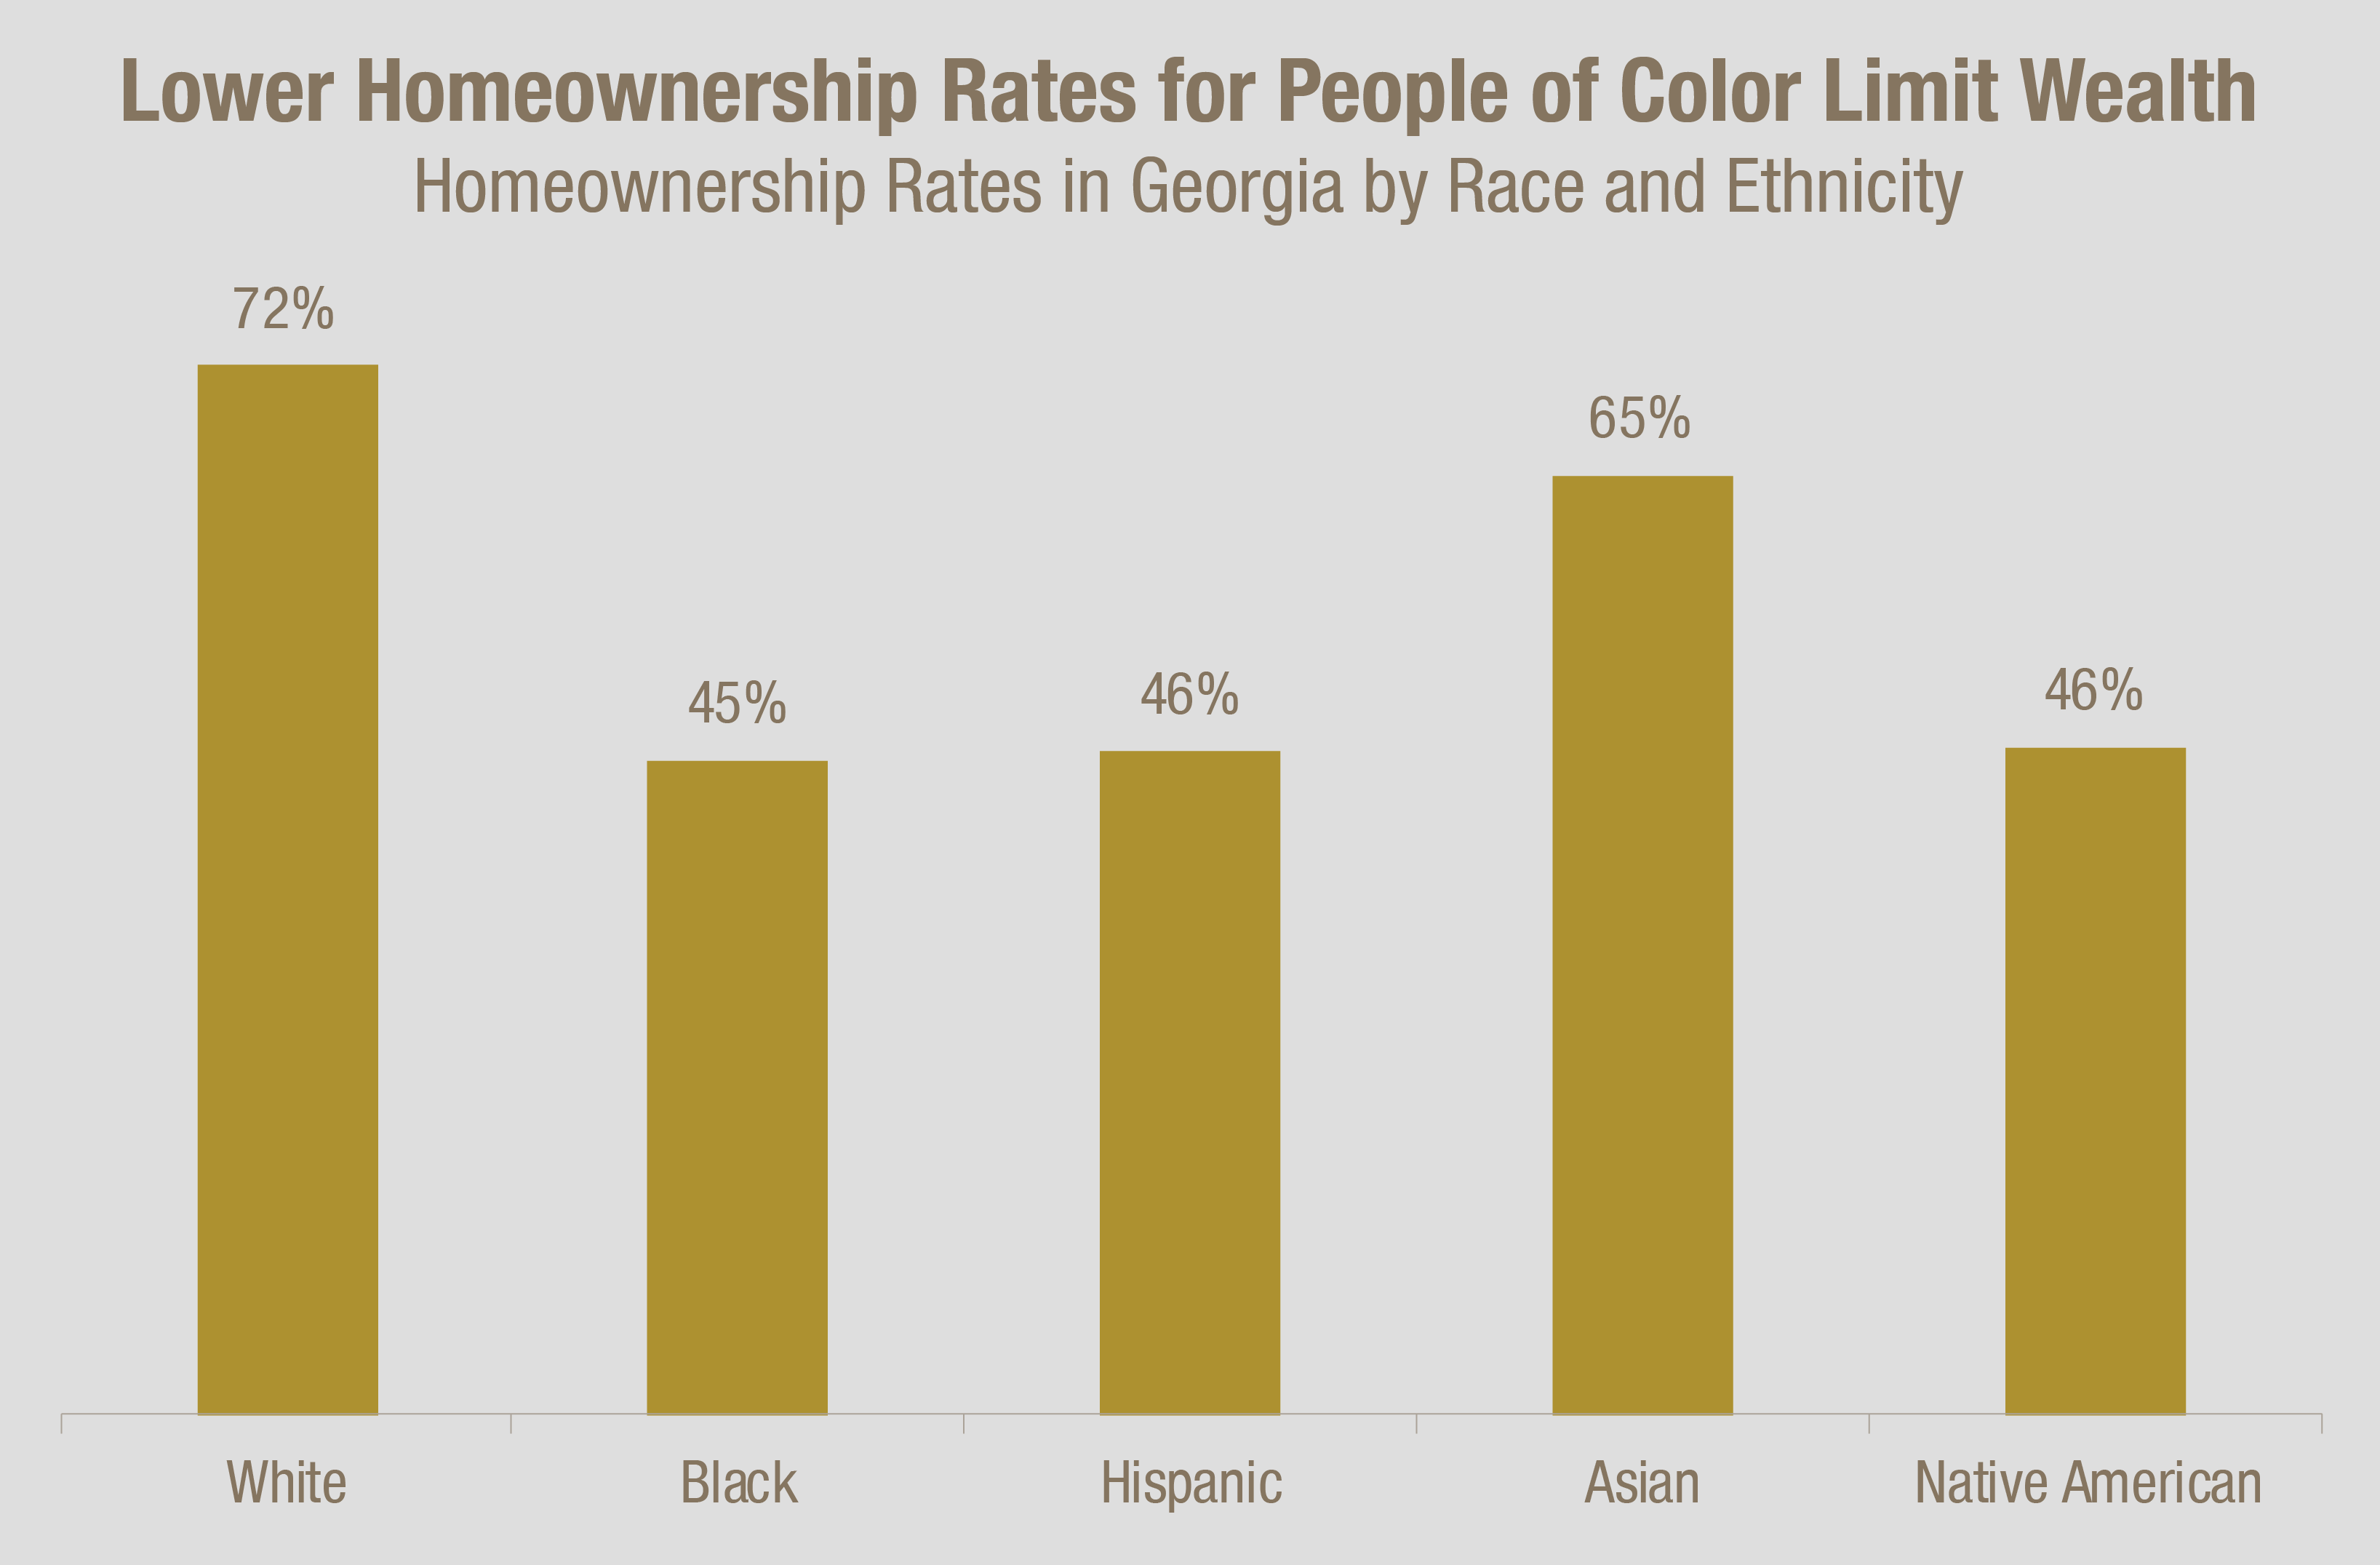
Lower Homeownership Rates, More Prevalent Subprime Lending Fall Especially Hard on Women of Color
Some of the gap between the homeownership rates of white people and people of color in Georgia is attributable to past discrimination. People of color were excluded from federal mortgage assistance programs through redlining, or the denial of mortgage loans to black people or people of other races who lived near black people.[74] Shut out of the home purchase process, black people were unable to build wealth through home equity that could be transmitted to future generations. Contemporary practices also act as a drag on the homeownership rate for households led by people of color. During last decade’s housing boom, banks and other lenders denied mortgages to black and Latino people at higher than average rates.[75] When households led by people of color got mortgage approval, it was more likely to be a subprime offer than for comparable white applicants.[76] Black and Hispanic women confronted the highest rates of subprime lending. Asian Pacific Islanders were also targeted by subprime lenders and were more likely to lose their homes to foreclosure.[77] Higher-cost, subprime lending and risk of foreclosure made homeownership a more expensive and riskier proposal for households led by people of color.[78]
Once households led by people of color bought homes, they were to more likely to build wealth through home equity than other assets. Home equity became the primary source of wealth for low- and moderate-income black and Hispanic households in 2001, with women making up a large share of mortgage borrowers. So, lost equity hit women of color especially hard. The crash of the mortgage market and the recession that began in 2007 wiped out billions of dollars in accumulated wealth for households led by people of color.[79]
In Atlanta, lost equity in hard-hit neighborhoods contributes to a recent decrease in black home buyers. The number of black homebuyers is down by half and their share of all homebuyers shrank to 22 percent from 28 percent from 2005 to 2015.[80] Black homeownership in Atlanta, for example, is also hurt by limited access to credit and the shortage of affordable homes.[81]
Strengthen Homeownership through Local and State Housing Trust Funds
Housing trust funds can be used to preserve home equity among Georgia women and increase homeownership rates. Housing trust funds are established by state and local governments when a source of public revenue is either allocated or dedicated to a distinct fund to provide affordable housing.
This money can support homeownership and help close the wealth gap. Housing trust funds nationally provide education and down payment assistance to homeowners. Trust funds can also be used to repair and preserve owner-occupied homes as well as create sustainably affordable owner-occupied homes.[82]
Georgia can Support Local Housing Trust Funds by Creating Access to New Sources of Revenue
City housing trust funds across the nation dedicate sources of revenue from diverse sources, including developer fees, property taxes, hotel/motel and short-term rental taxes, document recording taxes, real estate transfer taxes, and bond revenues. The most commonly dedicated sources of funding for city housing trust funds are developer impact fees and fees developers pay when developments fall short of affordable housing guidelines.[83]
Housing trust funds work on state and local levels. Local governments in Georgia can already create housing trust funds and transfer nontax revenues to those accounts.[84]
Atlanta and Savannah both operate local housing trust funds in Georgia.[85] The Atlanta BeltLine housing trust fund used tax increment financing to fund 785 affordable houses and apartments, well short of its 2030 goal.[86] Savannah’s housing trust fund used an $800,000 allocation of the city’s tax revenue from 2012 to 2016 to leverage millions of dollars in outside investment to spend $6.86 million on housing. This money was used to repair 105 houses, build 24 more and purchase another 11.[87]

The state can clear a barrier for local housing trust funds to do more. Georgia’s constitution prohibits imposing a tax and dedicating its revenues to one purpose, unless expressly authorized by law. This limits the types of fees available for dedication to Georgia’s local housing trust funds. Developer impact fees are expressly authorized by Georgia law, but only to pay for system improvements to public facilities to cite one example.[88] This prohibits Atlanta and Savannah from using developer impact fees to build housing trust funds and expand affordable housing options.
Georgia can give localities more options to boost affordable housing trust funds through enabling legislation. Fourteen other states passed laws that either encourage or enable affordable housing through dedicated funds, including Arizona, Florida and South Carolina.[89]
More revenue-raising options for local trust funds make it easier to establish them. This can create a new source of money to support homeownership.
More Money for the State’s Housing Trust Fund Could Support Homeownership Outside Large Metro Areas
More populated communities tend to attract more developers that help them sustain a greater number of taxable housing transactions. To support smaller and more rural communities, Georgia can direct more of its money to the state’s housing trust fund and distribute it to local communities as another way to support women’s wealth. Nearly one-third of Georgia’s women live outside of the state’s five largest metro areas.[90]
Georgia’s state housing trust fund now focuses its money and effort on preventing and mitigating homelessness. Georgia committed about $5 million through its housing trust fund in the fiscal year that ended June 30, 2017. Every dollar allocated to the State Housing Trust Fund leverages about $5 in federal funding.[91]
The money allocated to Georgia’s state housing trust fund pales in comparison to other states. New York, New Jersey and Connecticut and Washington, D.C. collected more than $50 million for state housing trust funds in 2015. Illinois, Ohio, Massachusetts, Hawaii, and Washington collected more than $20 million.[92] Ohio and Georgia have a comparable population.
Georgia can directly fund or match local housing trust funds with more money put in the state version. Georgia can also set aside some of the money for use in rural areas. Other states offer examples of these options and Georgia can bolster women’s homeownership in smaller cities and rural areas by following suit.
Florida, Iowa, Massachusetts and Washington operate state housing trust funds that directly fund or match local housing trust funds. Florida uses a majority of this money to support the State Housing Initiatives Partnership Program, allocating money to its cities and counties based on a formula.[93]
Kentucky, Ohio, Texas and half a dozen other states either set aside a portion of the money for rural areas or set a statutory target for that.
Georgia can follow the lead of other states by beefing up its housing trust fund. This money can go to cities or counties that might struggle to raise funds locally to sustain a local housing trust fund. Local governments can then use the money to preserve and expand homeownership through education, grants for repairs and down-payment assistance.
Both state and local government leaders can help increase women’s wealth through targeted housing trust funds. Grants for age-friendly modifications or repairs that help preserve home equity, as well as homeowner education coupled with down payment assistance can disproportionately help women. That aid can also help women more comfortably afford homes in neighborhoods that are more likely to appreciate in value.
Entrepreneurship: Fewer Business Owners, Lower Revenues Limit Women’s Wealth
Entrepreneurship is second only to homeownership as a way Americans build wealth.[94] Entrepreneurs also create jobs. New firms and young businesses account for about 70 percent of overall job creation and contribute disproportionately to net new jobs.[95]
Georgia is home to the greatest growth in women-owned businesses from 2002 to 2012.[96] Women own about 40 percent of Georgia firms. However, the rate of entrepreneurship for Georgia women continues to lag behind men. Closing the business ownership gap between women and men by boosting women’s entrepreneurship is likely to help the state to create more jobs.
Georgia Women Fall Behind Men in Business Ownership and Size
Businesses Owned, Ownership Rate and Firm Size by Gender (2012)
| Georgia Women | Georgia Men | |
| Businesses Owned | 376,506 | 480,578 |
| Business Ownership Rate Among Labor Force Participants | 17% | 19% |
| Share of Firms with $50,000 or more in Revenue | 14% | 35% |
Lower levels of social and financial capital help cause lower levels of women’s entrepreneurship, according to some studies. Women cite a lack of available mentors, or social capital, as a top challenge.[97] Women also have less access than men to business counseling and training.[98]
Women raise smaller amounts of capital to finance their firms and rely more on personal, rather than external, sources of capital, according to recent studies. For instance, venture capital funding of women-led businesses represented only 6 percent of that kind of investment in the U.S. from 1997 to 2000.[99] Women-owned businesses across the U.S. are also more likely to be younger and smaller than businesses men own. Smaller and newer businesses are less favored by bankers for both genders. This access to capital is especially important for growth-oriented firms, such as technology firms that require substantial amounts of external capital.[100]
Georgia women’s businesses are also smaller measured by revenue than those of Georgia men and women’s businesses nationwide. This contributes to the wealth gap between Georgia men and women as well the one between Georgia women and their peers in other states.
About 77 percent of women-owned businesses in Georgia bring in less than $25,000 in annual revenue, compared to 54 percent of businesses owned by Georgia men. Only 5 percent of women-owned firms report annual revenues of $250,000 or more, while 15 percent of businesses owned by men have revenues that reach that threshold.
Georgia women tend to own companies in lower-revenue industries. The top industries for women-owned business in the state are so-called other services, health care and social assistance. Other services include personal care, dry cleaning and laundry, pet care and death care.[101] The top two industries for men-owned businesses are construction and professional, scientific and technical services.
About 12 percent of businesses categorized as other services bring in $50,000 or more in revenue, compared to 30 percent of construction firms and 32 percent of businesses in professional, scientific and technical services.
Top Industries for Georgia Women-Owned and Men-Owned Businesses
Top industries for Georgia businesses by gender of majority ownership, ranked largest to smallest
| Industries for Women-Owned Businesses | Industries for Men-Owned Business | |
| 1 | Other services (e.g., personal care services, equipment repair, laundry services) | Construction |
| 2 | Health care and social assistance | Professional, scientific, and technical services |
| 3 | Administrative and support and waste management and remediation services | Other services (e.g., personal care services, equipment repair, laundry services) |
| 4 | Professional, scientific, and technical services | Administrative and support and waste management and remediation services |
| 5 | Retail trade | Real estate and rental and leasing |
Remarkable Growth in Businesses Owned by Women of Color, Work to Do to Increase Revenues
Businesses owned by women of color grew remarkably over the past decade. From 2007 to 2016, American Express estimates women of color owned 78 percent of the net new women-owned firms across the U.S.[102]Georgia is no exception. Women of color own more than 204,000 firms in the state, compared to 194,000 owned by white women.[103]
“Georgia’s Latina-owned businesses are growing at a faster rate than in any other state.
– American Express OPEN[104]
The average revenues per firm for Georgia businesses owned by white women still outpace those owned by women of color. Businesses owned by people of color tend to be in different industries, which explains some of the difference. Nationwide nearly 60 percent of all black-owned businesses are in the 20 lowest sales-generating industries while nearly 45 percent of businesses owned by Hispanic people are in these industries. Just 31 percent
of businesses owned by white people are in these industries.[105]
Many factors affect the types of industries that women of color are able to join, including high start-up costs, limited education, occupational exposure and social systems built on discriminatory practices. Black workers were limited to occupations serving white patrons before the 20th century, for example. In the 1900s, black businesses owners diversified industries, but still largely served black middle- and upper-income classes. Opportunities for black entrepreneurs to enter higher-revenue industries are rising in the 21st century, but representation in these industries still lags behind their white counterparts.[106]
High start-up costs and limited access to capital also likely affect the types of industries in which Hispanic and black women open shop. Ninety-four percent of businesses owned by Hispanic women rely on friends and family for money.[107] And lower wealth among Hispanic and black households leaves less money to fund the businesses of family members.[108]
Another factor affecting both business revenue and employment is the number of owners. Asian-owned firms are more likely than firms owned by other people of color to have multiple owners, likely due to their large share of family-owned firms. Nineteen percent of Asian-owned businesses nationwide are family-owned, compared to 9 percent for black-owned and 13 percent for Latino-owned businesses. Firms with multiple owners greatly outperform single-owner businesses.[109]
Georgia Women Business Owners by Race and Ethnicity, Industry and Revenues
| White | Black | Hispanic | Asian | Native American | |
| Businesses Owned | 193,729 | 153,513 | 23,966 | 23,274 | 3.274 |
| Average Revenues per firm | $198,000 | $22,000 | $56,000 | $175,000 | $51,000 |
| Share of Businesses with Paid Employees | 13% | 2% | 4% | 18% | 9% |
| Top Industry and Share of firms in Industry | Professional, scientific, and technical services (16%) | Other services
(e.g., personal care services, equipment repair, laundry services) (30%) |
Administrative and support and waste management and remediation services (30%) | Other services (46%) | Other services
(e.g., personal care services, equipment repair, laundry services) (22%) |
Bolster Entrepreneurship through Contracting Goals, Targeted Technical Assistance
Georgia can target support to strengthen and expand entrepreneurship for the state’s women business owners.
- Set goals for contracting with small businesses owned by women and people of color
- Increase technical assistance resources for immigrant women entrepreneurs
Georgia Can Set Goals for Contracting with Businesses Owned by Women and People of Color
Georgia can advance women-owned businesses by setting goals for state contracting relationships. Georgia can provide women-owned businesses with access to a statewide market by making it a priority to do business with them. Georgia purchases more than $4.5 billion in goods and services from suppliers each year.[110] Georgia does not publicly report how much business it does with women and people of color as other states do.

Georgia’s minority business certification program is designed to help increase the visibility of businesses owned by people of color. Georgia corporations can also earn a tax credit for payments made to subcontractors certified as minority businesses.[111] Still, the state’s minority business certification does not include women. And the state does not set goals to contract with women and people of color as some other states do.[112]
Fourteen states and Washington, D.C. established contracting goals for firms owned by women and people of color as of 2007, the latest year a summary is available. North Carolina, South Carolina, Texas and Virginia[113] are southern states that set targets. States set goals for the awarding of prime contracts or subcontracts. Goal programs nearly always allow a prime contractor to submit a waiver stating good faith effort was made to locate a subcontractor business owned by a woman or person of color.[114]
Maryland set a goal that 29 percent of all state procurement go to Minority Business Enterprises.[115] Minority Business Enterprises include those owned by people of color and women. The state began its program in 1978 and increased its goal to 25 percent from 14 percent in 2001 based on a disparity study.[116] Maryland increased its goal again in 2013 after reaching its benchmark in 2012.[117] The state also sets sub-goals for firms owned by black Americans, Hispanic Americans, Asian Americans and women that differ by the industry focus of the contract.[118]
Maryland awarded about $2.3 billion, or 26.2 percent, of its procurement to businesses owned by women and people of color in 2015, the latest year data is available.[119] The Minority Business Enterprise Program supported 22,128 direct full-time equivalent jobs, $917 million in direct wages and salaries and about $67.4 million in state and local tax receipts in 2014, the latest year for which data is available. The Maryland program generates a $1.62 in total economic impact per dollar of state procurement expenditures, when secondary effects are counted.[120]
Georgia can follow the lead of states like Maryland and set a benchmark for doing business with women and people of color. The state can open up a new market for women-owned businesses and lay the groundwork for them to increase revenues and wealth, providing a sturdier future for themselves and their families.
Georgia Can Increase Technical Assistance Resources for Immigrant Women Entrepreneurs
For a smaller group of entrepreneurs who already show strong growth potential, Georgia can provide targeted technical assistance. Georgia already offers technical assistance resources to small businesses through a number of agencies and programs. None of these programs seem to provide targeted and customized support for businesses owned by immigrants – a group more likely than native-born Americans to start businesses.
The state of Georgia provides:
- About $1 million annually to the activities of the Small and Minority Business Development program within the Department of Economic Development. The program educates community business groups statewide about state business resources and opportunities. It also hosts educational events and provides research to businesses connecting distributors and suppliers.[121]
- About $500,000 annually to its Entrepreneur and Small Business Outreach program, which helps bring training, education and mentoring services and resources to small businesses in rural Georgia.[122]
- Training, consulting and assistance to increase opportunities for all small companies doing business with the Georgia Department of Transportation through the department’s Small Business and Minority Business Enterprise programs. State lawmakers appropriated about $800,000 in the amended 2013 budget for this program, the latest year data is publicly available.[123]
To supplement these resources, Georgia can add a liaison or additional programming to leverage and grow the state’s strong base of immigrant entrepreneurs. Georgia experienced the most rapid growth of businesses owned by Hispanic women in the country from 2007 to 2016, according to American Express Open estimates. About 60 percent of Georgia’s Hispanic women are immigrants.[124]
“Immigrants have been nearly twice as likely as native-born Americans to start businesses.”
– Kauffman Foundation
Georgia can follow the lead of other states to help build on the phenomenal growth of businesses owned by immigrants. This assistance can, in turn, increase the wealth of immigrant women. In North Carolina the nonprofit Rural Entrepreneurship through Action Learning initiative partners with the state’s community colleges to offer a Spanish-language business planning curriculum taught by bilingual facilitators. It also provides business start-up training to Hispanic immigrants.
Nebraska fuels the Nebraska Enterprise Fund, a nonprofit that provides loans, technical assistance and training to self-employed businesses with five or fewer employees. Technical assistance is tailored to immigrant entrepreneurs by accommodating language and cultural barriers, distrust of financial institutions and lack of conventional credit histories.[125]
Georgia can maximize its support for immigrant entrepreneurs through a culturally competent and customized initiative. One of the best ways to meet these objectives is to employ or partner with first- or second-generation immigrants for training and consulting services.
Increasing technical assistance resources for immigrant woman entrepreneurs and setting contracting goals will allow Georgia to help the state’s women business owners build their firms. This growth can, in turn, increase women’s wealth by providing them with greater personal income that can be used to increase savings and economic security, further the education of their children, or make other revenue-generating investments.
Conclusion
Georgia can do more to build the long-term economic security of its families and households by building and growing the wealth of Georgia women. Women’s wealth is critical to the state’s future. Women are a majority of Georgia’s adult population and help shoulder the entire weight of their family’s economic well-being.
The state can remove barriers to women’s wealth building and at the same time reap positive benefits, including reducing racial disparities in many ways. Women earn less than men, leaving them with less to save and invest. They handle disproportionate caregiving responsibilities that drain their wealth. Women also contend with higher borrowing costs and less purchasing power that acts as a drag on their home equity. Women also own fewer and smaller businesses than men.
Georgia can focus on three areas to remove barriers and strengthen household finances for the future.
- Establish paid family and medical leave on the local and state levels
- Support local and state housing trust funds
- Bolster women’s entrepreneurship through contracting goals and targeted technical assistance
Acknowledgements
This report is made possible through the generous support of the Working Poor Families Project, a national initiative funded by the Annie E Casey, Joyce and W.K. Kellogg foundations; the Annie E. Casey Foundation Atlanta Civic Site, and the Kendeda Fund.
The Georgia Budget and Policy Institute is grateful to Prosperity Now for its analysis illustrating both the gender and racial wealth gaps as well as Mariko Chang for her groundbreaking insights on the women’s wealth gap.
Thanks also to representatives from the organizations listed here who participated in discussions of homeownership, entrepreneurship and paid family leave:
|
|
Endnotes
[1] Author’s calculation based on US Census Bureau, American Community Survey 2016 1-Year Estimates Table B01001.
[2] “The Status of Women in the South,” Institute for Women’s Policy Research, February 25, 2016. Also, 41 percent of low-income working families with children in Georgia are headed by women, based on the latest available data. See “Low Income Working Mothers and State Policy: Investing for a Better Economic Future,” The Working Poor Families Project, Winter 2013-2014.
[3] Alistair Fitzpaine and Ethan Pollack, “The Nature of Work is Changing – Policy Response Needs to Keep Pace,” Aspen Institute, February 28, 2017.
[4] “Startup Activity Swings Upward for Third Consecutive Year, Annual Kauffman Index Reports”, Kauffman Foundation, May 18, 2017.
[5] Heather McCulloch, “Closing the Women’s Wealth Gap: What It Is, Why It Matters, and What Can Be Done About It,” Closing the Women’s Wealth Gap Initiative, January 2017.
[6] Mariko Chang, Shortchanged: Why Women Have Less Wealth and What Can Be Done About It, Oxford University Press, September 2010.
[7] Data suggests that even married women do not share equally in the wealth generated by married couples. Mariko Lin Chang, Shortchanged Oxford University Press (2012).
[8] Technically, this number represents family households headed by single women. A family includes two or more people related by blood or marriage.
[9] “Do Women Still Spend Most of their Lives Married,” Center for Retirement Research at Boston College, August 2017.
[10] Abigail Abrams, “Divorce Rate in U.S. Drops to Nearly 40-Year Low,” Time, December 4, 2016.
[11] Women and Wealth: Insights for Grantmakers, Asset Funders Network, 2015.
[12] “High school students not graduating on time by race and ethnicity,” KidsCount Data Center, a Project of the Annie E. Casey Foundation.
[13] Georgia Higher Education Data Book, Georgia Budget and Policy Institute, August 22, 2017.
[14] US Census Bureau, American Community Survey 2016 1-Year Estimates Tables B20017.
[15] Working Poor Families Project Analysis of Analysis of American Community Survey, 2015 (Washington, D.C. Population Reference Bureau). References to “working families” refers to families with children under 18. A family is defined as “working” if all family members ages 15 and older either had a combined work effort of 39 weeks or more in the prior 12 months, or all family members ages 15 and older have a combined work effort of 26 to 39 weeks in the prior 12 months and one currently unemployed parent looked for work in the prior four weeks. A “low income” for a family of three with one child in 2015 was $38,156 per year.
[16] “GDP gains with racial equity,” National Equity Atlas, PolicyLink, http://nationalequityatlas.org/indicators/GDP_gains_with_racial_equity/7426/Georgia/false/. Accessed September 4, 2017.
[17] Background Readings for RACE: The Power of an Illusion, “Interview with Dalton Conley” PBS.org, http://www.pbs.org/race/000_About/002_04-background-03-03.htm. Accessed September 4, 2017. See also Dalton Conley, Being Black, Living in the Red: Race, Wealth, and Social Policy in America University of California Press, 2010.
[18] Su Jin Jez, “The Influence of Wealth and Race in College Attendance,” University of California, Berkeley, November 2008.
[19] “Lifetime Earnings Lost Due to the Gender Wage Gap” Institute for Women’s Policy Research, March 12, 2015.
[20] US Census Bureau, American Community Survey 2016, 1-Year Estimates. Table B20017.
[21] Author’s calculation based on US Census Bureau, American Community Survey 2016, 1-Year Estimates. Earnings are for full-time, year-round workers.
[22] “Wealth Inequality and Asset Depletion among Single Early Baby Boomers: Differences by Gender, Race/Ethnicity and Home Ownership in Retirement Readiness,” Institute for Women’s Policy Research, January 2017.
[23] “The Status of Women in the South,” Institute for Women’s Policy Research, February 25, 2016.
[24] Table 32, National Compensation Survey, Bureau of Labor Statistics, March 2016. Only 14 percent of workers nationwide and in South Atlantic states have access to paid family leave.
[25] Steven F. Hipple, “People who are not in the labor force: why aren’t they working?,” Beyond the Numbers: Employment & Unemployment, vol. 4, no. 15 (U.S. Bureau of Labor Statistics, December 2015), http://www.bls.gov/opub/btn/volume-4/people-who-are-not-in-the-labor-force-why-arent-they-working.htm (accessed July 7, 2016).
[26] “The Status of Black Women in the United States,” Institute for Women’s Policy Research, June 7, 2017.
[27] “The MetLife Study of Caregiving Costs to Working Caregivers: Double Jeopardy for Baby Boomers Caring for Their Parents,” MetLife Mature Market Institute, June 2011.
[28] “Expecting Better: A State by State Analysis of Laws That Help New Parents” National Partnership for Women and Families, August 2016.
[29] “The Status of Women in the South,” Institute for Women’s Policy Research, February 25, 2016.
[30] Economic Policy Institute analysis of Current Population Survey data, 2016.
[31] Mariko Lin Chang, Shortchanged Oxford University Press (2012) (citing Stephen Rose and Heidi Hartmann, “Still a Man’s Labor Market: The Long-Term Earnings Gap,” Institute for Women’s Policy Research, 2004).
[32] Mariko Lin Chang, Shortchanged Oxford University Press (2012) (citing Joan Raymond, “The Ex-Files – Corporate Marketing Campaigns Focusing on Divorced Women” American Demographics, February 2001.)
[33] “The MetLife Study of Caregiving Costs to Working Caregivers: Double Jeopardy for Baby Boomers Caring for Their Parents,” MetLife Mature Market Institute, June 2011.
[34] “The Status of Women in the South,” Institute for Women’s Policy Research, February 25, 2016.
[35] Table 32, National Compensation Survey, Bureau of Labor Statistics, March 2016
[36] Author’s calculation based on U.S. Census Bureau, American Community Survey, 2016 1-year estimates.
[37] Economic Policy Institute analysis of 2016 Current Population Survey data.
[38] “The MetLife Study of Caregiving Costs to Working Caregivers: Double Jeopardy for Baby Boomers Caring for Their Parents,” MetLife Mature Market Institute, June 2011; 2008 American Community Survey, U.S. Census, 1-year estimates.
[39] “The Status of Black Women in the United States,” Institute for Women’s Policy Research, June 7, 2017.
[40] “The Status of Black Women in the United States,” Institute for Women’s Policy Research, June 7, 2017.
[41] Author’s calculation based on US Census Bureau, American Community Survey 2016, 1-Year Estimates.
[42] “13 percent of private industry workers had access to paid family leave in March 2016,” Bureau of Labor Statistics, U.S. Department of Labor. https://www.bls.gov/opub/ted/2016/13-percent-of-private-industry-workers-had-access-to-paid-family-leave-in-march-2016.htm. Accessed September 9, 2017.
[43] Economic Policy Institute analysis of 2016 Current Population Survey data.
[44] “Data Summaries” Georgia, National Equity Atlas, PolicyLink.
[45] U.S. Bureau of Labor Statistics. National Compensation Survey: Employee Benefits in the United States, March 2017 (Table 32). The Bureau of Labor Statistics defines southern Atlantic states to include: Delaware, DC, Florida, Georgia, Maryland, North Carolina, South Carolina, Virginia, and West Virginia.
[46] “State Paid Family Leave Insurance Laws,” National Partnership for Women and Families, July 2017,
[47] “In Your State,” Family Values @ Work, http://familyvaluesatwork.org/states. Accessed September 7, 2017.
[48] “State Paid Family Leave Insurance Laws,” National Partnership for Women and Families, July 2017.
[49] Washington will give employers the option of deducting the costs of the family leave insurance premium from employee wages. In the other states (not including DC), the employees pay a tax to fund the program.
[50] Beginning in 2018 California will have a two-tiered system where lower-wage workers get 70 percent of their average weekly wage and other workers will receive 23.3 percent of the state’s average weekly wage OR 60 percent of the worker’s weekly wage, whichever is greater. National Partnership for Women and Families, July 2017. California’s average weekly wage is $1206.92. “DWC Announces Temporary Total Disability Rates for 2018,” California Department of Industrial Relations, June 20,2017.
[51] For workers paid more than 150 percent of the D.C. minimum wage multiplied by 40, the weekly benefit rate is 90 percent of 150 percent of the D.C. minimum wage multiplied by 40 plus 50 percent of the amount by which the worker’s average weekly wage exceeds 150 percent of the D.C. minimum wage multiplied by 40.” Workers in Washington who are paid more than 50 percent of the statewide Average Weekly Wage (AWW) receive 90 percent of the employee’s AWW up to 50 percent of the statewide AWW, plus 50 percent of the employee’s AWW that is more than 50 percent of the statewide AWW.
[52]New York’s maximum benefit is actually 50 percent of state’s average weekly wage and will vary from year to year. New York State Average Weekly Wage for calendar year 2016 is $1305.92.
[53] “Expecting Better: A State-by-State Analysis of Laws that Help Expecting and New Parents,” National Partnership for Women and Families, August 2016. (Citing Houser L. & Vartanian, T.P., Policy Matters: Public Policy, Paid Leave for New Parents, and Economic Security for U.S. Workers, Center for Women and Work at Rutgers, The State University of New Jersey Publication, April 2012.)
[54] “Expecting Better: A State-by-State Analysis of Laws that Help Expecting and New Parents,” National Partnership for Women and Families, August 2016.
[55] “Expecting Better: A State-by-State Analysis of Laws that Help Expecting and New Parents,” National Partnership for Women and Families, August 2016.
[56] “The Impact of Paid Family Leave on New Jersey Businesses,” New Jersey Business and Industry Association, Fall 2012.
[57] Ann Bartel, Maya Rossin-Slater, Christopher Ruhm, Jane Waldfogel, “Assessing Rhode Island’s Temporary Caregiver Insurance Act: Insights from a Survey of Employers,” January 2016. A majority (61%) of Rhode Island employers – surveyed in early 2015, one year after the law came into effect – said they were either strongly or somewhat in favor of the temporary caregiver insurance program. “An additional 15% said they were neither in favor nor opposed, leaving just under one-quarter (24%) who either somewhat or strongly opposed the program.”
[58] Virginia has approximately 8 million residents compared to Georgia’s 10 million. U.S. Census Bureau, American Community Survey, 2016 1-year estimates. Virginia has nearly 63,000 state employees. Employee Count, Virginia Department of Human Resource Management, August 31, 2017.
[59] “Expecting Better: A State-by-State Analysis of Laws that Help Expecting and New Parents,” National Partnership for Women and Families, August 2016.
[60] Ill. Admin. Code tit. 80 §§ 303.120, 303.90, 303.250, ftp://www.ilga.gov/jcar/admincode/080/08000303sections.html; Ohio Rev. Code Ann. § 124.136, http://codes.ohio.gov/orc/124.136; Ohio Admin. Code § 123.1-32-05, http://codes.ohio.gov/oac/123%3A1-32; Va. Code. Ann. §§ 51.1-1100, 51-1-1110; https://law.lis.virginia.gov/vacode/title51.1/chapter11/section51.1-1104/; “Annual Leave,” Va. Dept. of Human Resources Management Policies and Procedures Manual, http://www.dhrm.virginia.gov/docs/default-source/hrpolicy/pol4_10annlv.pdf?sfvrsn=2. All accessed September 7, 2017.
[61] “About State Government” Team Georgia Careers. Personal leave is available as a conversion from sick leave.
[62] “State of Georgia Disability Claim Packet Instructions,” Standard Insurance Company.
[63] “2017 You Decide” Annual Enrollment, Georgia Department of Administrative Services, https://doas.ga.gov/assets/Human%20Resources%20Administration/Flexible%20Benefits%20Resources%20Copy/2017%20You%20Decide%20Booklet10032016%20(002).pdf..Accessed September 7, 2017. Ga. Comp. R. and Regs. § 478-1-.23.
[64] Joi Dukes, “Macon-Bibb Commission Approves Paid Parental Leave for Employees”, 41 WGMT, June 6, 2017.
[65] Joi Dukes, “Macon-Bibb Commission Approves Paid Parental Leave for Employees”, 41 WGMT, June 6, 2017.
[66] “New and Expanded Employer Paid Family and Medical Leave Policies (2015-2017),” National Partnership for Women and Families, May 2017.
[67] “Wealth Inequality and Asset Depletion among Single Early Baby Boomers: Differences by Gender, Race/Ethnicity, and Home Ownership in Retirement Readiness,” Institute for Women’s Policy Research, January 2017.
[68] “Homeownership by Gender,” Prosperity Now Scorecard.
[69] Laurie Goodman, Jun Zhu, and Bing Bai, “Women are Better than Men at Paying their Mortgages” Urban Institute, September 2016 (citing Ping Cheng, Lin (Len) Shenguo, and Liu Yingchun, “Do Women Pay More for Mortgages?” Journal of Real Estate Finance and Economics 43(4):423-40, 2011; Allen Fishbein and Patrick Woodall, “Women are Prime Targets for Subprime Lending: Women are Disproportionately Represented in High Cost Mortgage Market” Consumer Federation of America: Washington, DC, 2006.)
[70] Laurie Goodman, Jun Zhu, and Bing Bai, “Women are Better than Men at Paying their Mortgages” Urban Institute, September 2016.
[71] “Homeownership More Profitable for Single Men Than Single Women,” Realtytrac, May 25, 2016, http://www.realtytrac.com/news/home-prices-and-sales/realtytrac-housing-gender-gap-analysis/, Accessed September 1, 2017.
[72] “Life Expectancy at Birth (in years), by Gender,” Kaiser Family Foundation State Health Facts, http://www.kff.org/other/state-indicator/life-expectancy-by-gender/?currentTimeframe=0&sortModel=%7B%22colId%22:%22Location%22,%22sort%22:%22asc%22%7D . Accessed September 3, 2017.
[73] Shannon Rieger, “As Baby Boomers Age, Older Single Women Will Face the Greatest Housing Challenges,” Harvard Joint Center for Housing Studies, September 12, 2016.
[74] Alexis Madrigal, “The Racist Housing Policy that Made Your Neighborhood,” The Atlantic, May 22, 2014.
[75] Emily Badger, “The Dramatic Racial Bias of Subprime Lending During the Housing Boom,” CityLab, August 16, 2013.
[76] Emily Badger, “The Dramatic Racial Bias of Subprime Lending During the Housing Boom,” CityLab, August 16, 2013.
[77] Heather McCullough, “Closing the Women’s Wealth Gap: What It Is, Why It Matters, and What Can Be Done About It,” Closing the Women’s Wealth Gap Initiative, January 2017.
[78] Gillian B. White, “Why Blacks and Hispanics Have Such Expensive Mortgages,” The Atlantic, February 25, 2016.
[79] Heather McCullough, “Closing the Women’s Wealth Gap: What It Is, Why It Matters, and What Can Be Done About It,” Closing the Women’s Wealth Gap Initiative, January 2017.
[80] “Chapter 4: Homeownership,” State of the Nation’s Housing 2017, Joint Center for Housing Studies of Harvard University, June 2017.
[81] “Homeownership Rate A Growing Concern,” SaportaReport, July 10, 2017.
[82] 2016 Housing Trust Fund Survey Report, Center for Community Change.
[83] 2016 Housing Trust Fund Survey Report, Center for Community Change.
[84] Frank Alexander, “Housing Trust Funds for Local Governments in Georgia”, Fannie Mae Foundation, March 2002; O.C.G.A.§§ 36-71-2; 36-71-3; 36-71-8.
[85] “City Housing Trust Fund Revenues 2017,” Housing Trust Fund Project, Center for Community Change.
[86] Willoughby Mariano , Lindsey Conway and Anastaciah Ondieki, “How the Atlanta Beltline broke its promise on affordable housing,” Atlanta Journal Constitution, July 13, 2017
[87] “Savannah Affordable Housing Fund, A Local Partnership for Affordable & Workforce Housing,” http://www.savannahga.gov/DocumentCenter/View/3302 . Accessed September 9, 2017.
[88] Frank Alexander, “Housing Trust Funds for Local Governments in Georgia”, Fannie Mae Foundation, March 2002; O.C.G.A.§§ 36-71-2; 36-71-3; 36-71-8.
[89] “State Housing Trust Funds,” Housing Trust Fund Project, Center for Community Change, https://housingtrustfundproject.org/housing-trust-funds/state-housing-trust-funds/ . Accessed September 10, 2017.
[90] Author’s calculation based on US Census Bureau, American Community Survey 2015, 5-Year Estimates.
[91] September presentation to Senate Study Committee on Homelessness, Georgia Department of Community Affairs. In 2014, the latest year for which an annual report is available, about 38 percent of the state money spent through the state housing trust fund was on Emergency Solutions Grants, including emergency shelter, transitional housing, homeless prevention, supportive services, and connecting homeless people with services. Another 44 percent of funds were spent on a Shelter Plus Care program. The total $3.3 million spent by the Housing Trust Fund in 2014 does not include approximately $655,000 spent for Re-Entry Partnership Housing. The program provides rental assistance along with supportive services funded by other sources. Annual Report Fiscal Year 2014, State Housing Trust Fund for the Homeless Commission, Georgia Department of Community Affairs. Figure does not include approximately $655,000 spent for Re-Entry Partnership Housing.
[92] 2016 Housing Trust Fund Survey Report, Center for Community Change.
[93] “The Housing Trust Fund Movement Spans the Country,” Housing Assistance Council.
[94] “Businesses and Jobs,” Prosperity Now Scorecard.
[95] John Haltiwanger, Henry Hyatt, Erika McEntarfer, Liliana Sousa, “Job Creation, Worker Churning, and Wages at Young Businesses,” November 2012.
[96]“The Growth and Development of Women-Owned Enterprises in the United States, 2002 – 2012,” National Women’s Business Council.
[97] “Sources of Economic Hope: Women’s Entrepreneurship,” Kauffman Foundation, November 2014.
[98] Institute for Women’s Policy Research, “Economic Security for Survivors”, Quarterly Newsletter Winter / Spring 2017 Issue.
[99] “Venture Capital, Social Capital and the Funding of Women-led Businesses,” Small Business Association Office of Advocacy, April 2013.
[100] Alicia Robb, Access to Capital among Young Firms, Minority-owned Firms, Women-owned Firms, and High-tech Firms, April 2013.
[101] “Other services (except Public Administration),” Industries at a Glance, Bureau of Labor Statistics, US Dept. of Labor, https://www.bls.gov/iag/tgs/iag81.htm. Accessed August 11, 2017.
[102] “The 2016 State of Women-Owned Businesses,” American Express OPEN, April 2016.
[103] Author’s calculation based on 2012 Survey of Business Owners, U.S. Census Bureau, 2015.
[104] “The 2016 State of Women-Owned Businesses: Summary Tables,” American Express OPEN, April 2016.
[105] Michael McManus, Minority Business Ownership: Data from the 2012 Survey of Business Owners (Washington, DC: U.S. Small Business Administration, 2016), https://www.sba.gov/sites/default/files/advocacy/Minority-Owned-Businesses-in-the-US.pdf. Accessed September 5, 2017.
[106] Spectra Myers and Pamela Chan, “Stuck from the Start: The Financial Challenges of Low- and Moderate-Income African-American Entrepreneurs in the South,” Prosperity Now, July 2017.
[107] Robyn Moreno, “Money Madrinas: 12 Latinas Who Invest in Other Women,” Latina, May 18, 2017.
[108] See “Net Worth,” Prosperity Now Scorecard, http://scorecard.prosperitynow.org/data-by-issue#finance/outcome/net-worth. Accessed September 5, 2017.
[109] Michael McManus, Minority Business Ownership: Data from the 2012 Survey of Business Owners (Washington, DC: U.S. Small Business Administration, 2016), https://www.sba.gov/sites/default/files/advocacy/Minority-Owned-Businesses-in-the-US.pdf. Accessed September 5, 2017.
[110] FY2016 Supplier Orientation, Georgia Department of Administrative Services. http://doas.ga.gov/assets/State%20Purchasing/Documents%20for%20Getting%20Started%20as%20a%20Supplier/FY2016%20Supplier%20Orientation.pdf. Accessed September 11, 2017.
[111] O.C.G.A. § 48-7-38.
[112] “FAQ: Minority Business Enterprise Certification”, http://doas.ga.gov/state-purchasing/FAQ. Accessed September 11, 2017.
[113]Virginia is not included within the 14 states with goal-based programs because its goal includes small, women, and minority businesses.
[114] “State Policies and Programs for Minority- and Women-Business Development,” Insight Center for Community Economic Development, December 14, 2007.
[115] See “Minority Business Enterprise Program” Governor’s Office of Small, Minority & Women Business Affairs, http://goma.maryland.gov/Pages/mbe-Program.aspx . Accessed September 11, 2017.
[116] “State Policies and Programs for Minority- and Women-Business Development,” Insight Center for Community Economic Development, December 14, 2007.
[117] “Maryland to raise minority business goal to 29 percent,” Baltimore Sun, April 29, 2013.
[118] “State of Maryland Minority Business Enterprise (MBE) Program Subgoal Directive and Guidelines for Setting Contract Subgoals,” Maryland Governor’s Office of Minority Affairs.
[119] Annual Report: Minority Business Enterprise Program and Small Business Reserve Program, Maryland Governor’s Office of Minority Affairs, Fiscal Year 2015.
[120] Economic Impact of the Maryland Minority Business Program, Maryland Governor’s Office of Minority Affairs, Fiscal Year 2014.
[121] Georgia’s 2018 Fiscal Year Budget (HB 44), signed by governor.
[122] Zero-based budget reports, Fiscal Year 2015, Governor’s Office of Planning and Budget, State of Georgia. Additionally, a number of resources funded by the federal Small Business Administration are also located in Georgia. These resources include the Small Business Development Center at the University of Georgia and the Women’s Business Center at ACE in Norcross and Edge Connection in Cobb County. All of these resources provide technical assistance and consulting to small businesses.
[123] Zero-based budget reports, Fiscal Year 2015, Governor’s Office of Planning and Budget, State of Georgia.
[124]Author’s calculation based on US Census Bureau, American Community Survey 2016, 1-Year Estimates.
[125] Erin Andrew, “Rising to the Immigrant Integration Challenge: What States Are Doing – And Can Do,” November 4, 2009.