School districts across Georgia face financial challenges that limit their ability to meet the needs of all students, especially when they’re from low-income families. This jeopardizes Georgia’s economic future. The state needs a skilled workforce to attract and develop industries with jobs that pay well. Tomorrow’s workforce is in classrooms across the state today. Instead of making strategic investments in these students, state lawmakers:
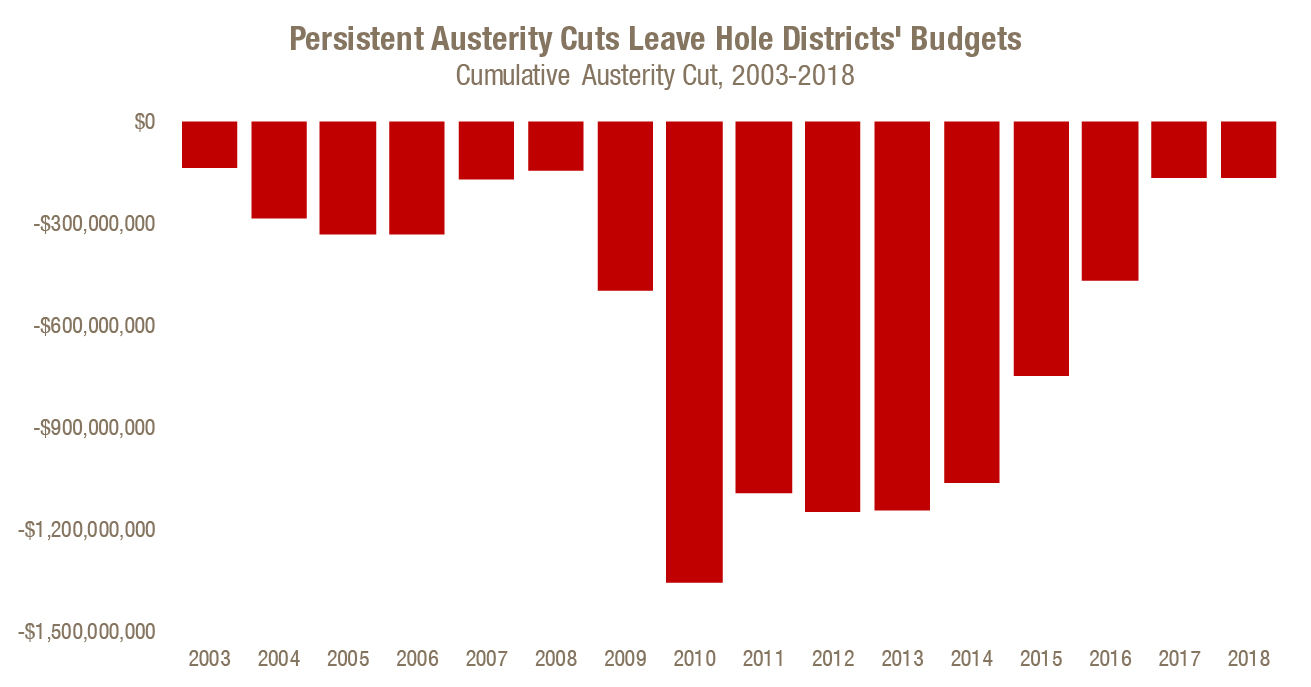
- Halted progress in reversing years of deep cuts in state funds for public schools, leaving districts short $167 million in in the 2018 fiscal year
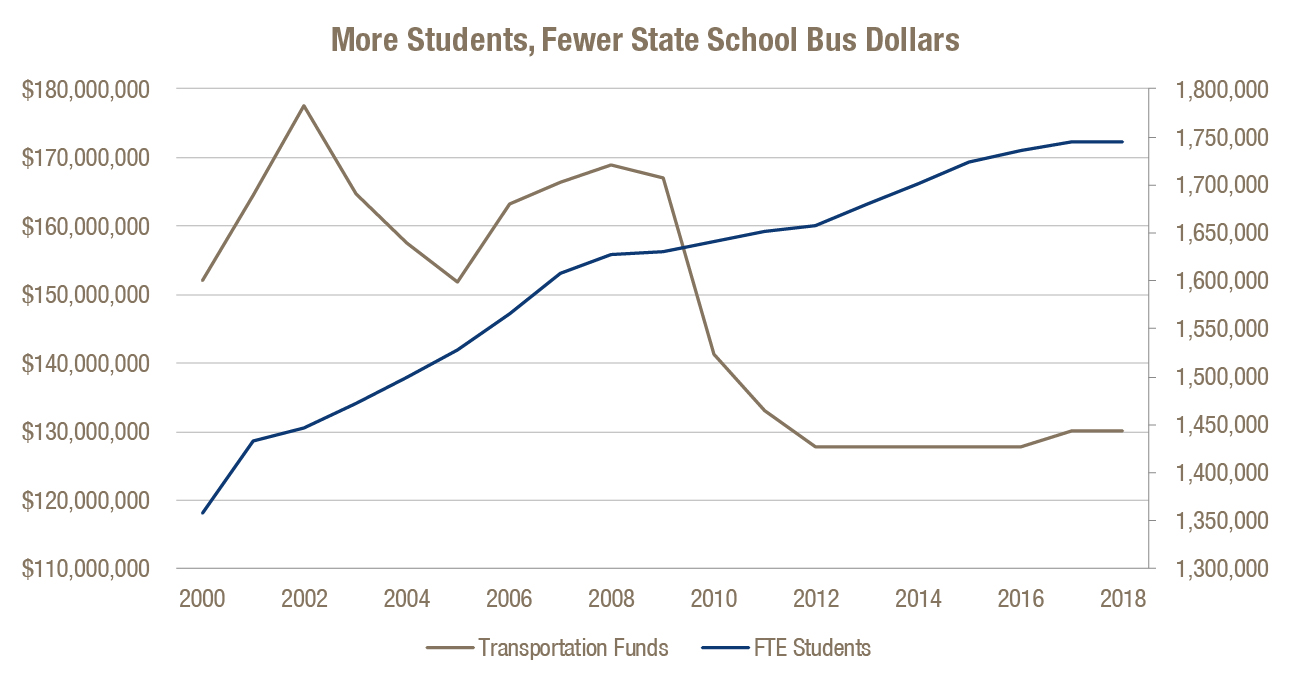
- Reduced funding for student transportation expenses, pushing districts to shift local money from classroom instruction to busing
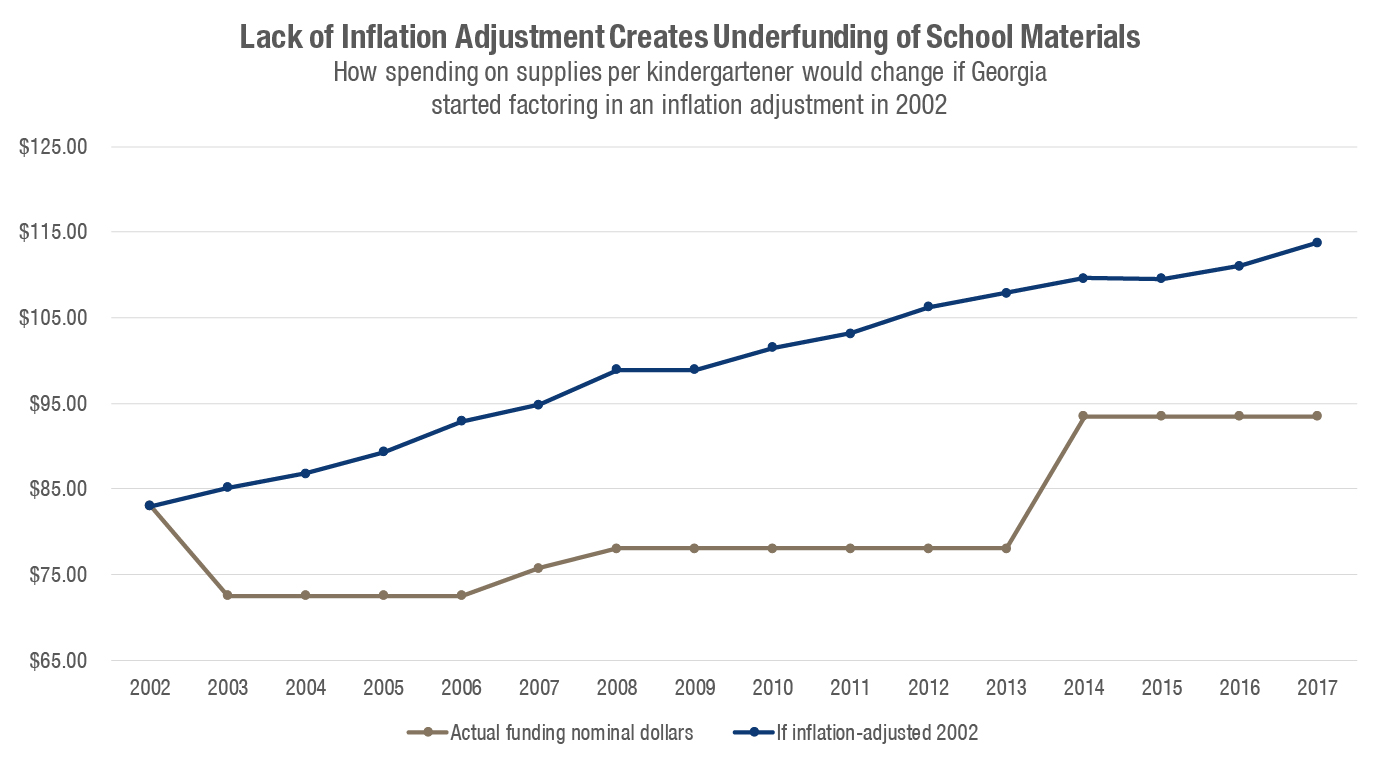
- Failed to ensure that state dollars for public schools keep pace with inflation
These issues are connected by an overarching concern: The 32-year-old state formula for funding public schools no longer aligns with students’ needs and the learning goals the state sets for them. This is particularly threatening to the academic success of low-income students who require more instructional support than their better-off peers. Extra investment in these students leads to improved learning, staying in school longer and increased earnings as adults.
Lawmakers need to solve current funding problems and develop a more strategic approach to support students in the years ahead. This approach should be based on a comprehensive assessment of the cost of educating all students to the state’s current academic performance goals.
Austerity Cut Shortchanges Districts
The Legislature imposed an austerity cut on state funding for school districts every year since 2003. It sent them less money than the state’s public schools funding formula calculated districts should get for their students. This continued shortfall affects all districts but is a greater challenge for communities that rely more heavily on state funds, often in rural areas.
$9.2 Billion – Total austerity cut in Georgia state funds
for K-12 schools since 2003
The size of the austerity cut varied over the years. It hit bottom from 2010 to 2014, when it topped $1 billion or higher each year. Facing a huge budget hole, districts chopped days off the school calendar, eliminated teaching positions and raised class sizes, furloughed teachers and other staff, and cut student programs such as art, music and elective classes.
The General Assembly began restoring funds to shrink the austerity cut in the 2015 budget. By 2017 lawmakers added back $894 million. This enabled districts to begin restoring core services and reduced the austerity cut to $167 million in 2017. Lawmakers left it at this level in 2018.
The consequences to students likely come in the form of larger classes, fewer art and music classes or electives, and fewer extra supports for struggling learners. The ongoing austerity cut can make it harder for districts to cover routine costs like facility maintenance, add professional staff or consultants to support school improvement, and balance budgets.
While lawmakers budgeted significant amounts of money in recent years to shrink the overall austerity gap, it’s important to note that the net gain for local districts is less than it first appears. Georgia districts are reeling from a sharp increase in health care costs lawmakers caused in 2012 when they eliminated state funding for bus drivers, custodians and other non-teaching staff covered by State Health Benefit Plan.
District spending on health insurance for non-teaching staff climbed $430 million from the 2012 to 2018 budget years due to the change.[1] That takes a sizable bite out of the additional state dollars restored to the Quality Basic Education funding formula. Rising retirement costs exacerbate these pressures.
Shrinking State Funds for Student Transportation
State funding for student transportation is also dwindling, leaving districts to cover most of the cost of getting students to and from school safely. Districts spent $824 million to bus students in fiscal year 2016, the most current year available.[2] The state contributed $127 million, about 15 percent, which is a big drop from earlier years. The state covered 39 percent in 2000 and 49 percent in 1996.[3] [4]
State support is so low because the Legislature is not providing the full amount of money calculated by the state’s student transportation formula. In addition, the student enrollment data used in the formula is very old. The most recent data for any district is from 2002 but districts will enroll nearly 300,000 more students in the 2017-2018 school year than 15 years earlier.
 Districts must ensure students get to school. Georgia mandates schools provide transportation and students cannot learn if they are not in class.[5] If state funding falls, districts are left to fill the gap with local funds. With more local money going to busing, there is less to spend in classrooms on teaching and learning.
State Dollars for Students Don’t Keep Pace with Inflation
The cost of supplies, services and staff needed to operate schools typically rise with inflation but the state’s K-12 funding formula does not routinely factor this in. The formula received periodic updates since its implementation in the 1986-1987 school year, but these adjustments were sporadic and lag behind actual inflationary increases. Districts are on the hook for escalating costs.
This problem is illustrated by the infrequent adjustments to the formula’s instructional operational costs for each kindergartener. These costs include paper, textbooks, lab equipment and replacement equipment. The state adjusted spending on these things four times from the 2002 fiscal year to 2018, including one cut. The $93.46 allocated in the 2018 budget year for each kindergartener’s materials is higher than the dollar amount from much of the past decade before taking inflation into account. The allotment would be about $114 if it kept pace with inflation since 2002.
 The importance of adjusting for inflation is even starker in other categories of the funding formula, including students taking Career, Technical and Agricultural Education classes. From the 2002 to 2018 budget years, funding for each of these student’s supplies slipped from $347.50 to $341.23 for a decrease of $6.27 even before taking inflation into account. Once adjusting to reflect the rising costs of goods and services, effective spending for supplies for these students is $129 lower. This undermines the growing interest in increasing the number of students enrolled in these courses to gain skills needed to smoothly transition to the workforce or to postsecondary training and study.
37% – How much more elementary schools would get for supplies and other operating costs if the state adjusted the K-12 formula for inflation
State adjustments are even less frequent for other components of today’s formula. The state did not adjust operations funding for elementary schools from the 2002 budget year through 2018. Elementary schools got $3,529 to cover supplies, travel, equipment replacement and other miscellaneous costs in 2002, the same amount budgeted in 2018. That’s the equivalent of a 37 percent funding cut in inflation-adjusted dollars. Operations funding was also flat for middle and high schools as well as alternative education programs.
Outdated Funding Formula No Longer Matches State’s Needs
The General Assembly approved Georgia’s formula to fund public schools in 1985 and it was implemented in the 1986-1987 school year. The Legislature tinkered with it since then but the formula is in need of comprehensive review and revision to ensure it aligns with the changing needs of Georgia’s students and the academic goals the state has set for them.
Increasing Student Poverty
Since 2002, the percentage of low-income students in Georgia’s public schools grew from about 45 percent to more 60 percent as measured by their participation in the federal free- and reduced-price lunch program. These children typically face hurdles to reaching high levels of academic achievement. These include:
- Knowing far fewer words at age three than middle- and upper-income children, which hinders their development of reading and writing skills.[6]
- More frequent vision problems but less likelihood of receiving treatment for these problems than children who are not poor.[7] This also impairs literacy and other skill development.
- More frequent experience of health problems such as asthma. This leads to increased school absences, which is linked to poor academic performance.
- Increased risk of mental health issues including depression, behavioral problems and substance abuse, which can interfere with learning.[8]
These barriers can be overcome through various strategies including small class sizes in early grades, one-on-one instruction, instructional coaches or other job-embedded professional development for teachers and school leaders, literacy specialists, access to counselors and social workers, and school-based health clinics or other medical services. These strategies require additional money. When extra money is provided and sustained, low-income students do better in school and are more economically secure as adults.[9] The likelihood that they will graduate from high school jumps about 10 percent and the hourly wages they earn as adults by about 13 percent.[10]
Rising Student Expectations
State leaders raised performance standards for Georgia’s students several times since the state adopted its 32-year-old funding formula. Performance standards outline what students are expected to know and be able to do in each grade level and subject area. The Georgia Standards of Excellence are the standards now in place and are more rigorous than the standards instituted in 1985, called the Quality Core Curriculum.[11] The standards are designed to prepare every student for college and a career. The Legislature left the funding formula unchanged rather than ensure it aligns with the new standards and provides each district with the resources its students need to meet these standards.
Recommendations
Georgia must develop a workforce with the knowledge and skills needed to attract and develop high-wage industries. Its economic future and the well-being of communities across the state depend on it. Realizing that goal requires a strong system of public schools that provide every student an opportunity to learn. Such systems typically include high quality teaching and rigorous standards and assessments aligned to those standards, areas where Georgia is making progress. It also requires adequate funding, which is where Georgia continues to fall short. To address this in the short-term, the General Assembly should:
- Reverse the remaining austerity cut of $167 million
- Cover a minimum of 50 percent of districts’ state-mandated transportation costs as calculated using current student bus usage data
- Update the state’s 32-year-old school funding formula to reflect today’s dollars and adjust it for inflation annually in the future
To ensure schools receive adequate funding long term, the General Assembly should also authorize a study to determine how much it costs to ensure every student is able to meet the goals outlined in the Georgia Standards of Excellence.[12] These studies are an essential component of designing school funding systems that align with performance standards.[13] The Legislature should then develop a plan to align funding with the study’s findings. Similar past initiatives include Gov. Nathan Deal’s 2015 Education Reform Commission. The commission examined ways existing state funding can be redistributed and used more flexibly. It did not undertake an adequacy study to address the question of cost. Answering this question is essential to students’ success and to the state’s economic future.
Endnotes
[1] The amount districts pay every month to the State Health Benefit Plan for non-teaching staff climbed from $296.20 in fiscal year 2012 to $945 in 2018.
[2] Georgia Department of Education. School System Expenditure Report, Fiscal Year 2016.
[3] Georgia Department of Education, School System Expenditure Report, Fiscal Year 2000 and Mid-term Allotment Sheet Fiscal Year 2000.
[4] Georgia Department of Education (2011) State Education Finance Study Commission, Issue Paper: Student Transportation. Retrieved from http://archives.gadoe.org/_documents/fbo_financial/StudyCommission/Pupil%20Transportation%20Staff%20Presentation.pdf.
[5] Georgia requires districts to provide transportation to all students with disabilities and those who live more than 1.5 miles from their designated schools.
[6] Hart, B. & Risley, T. R. (2003) The Early Catastrophe: The 30 Million Word Gap by Age 3. American Educator. Spring 2003. Retrieved from https://www.aft.org/sites/default/files/periodicals/TheEarlyCatastrophe.pdf .
[7] Perkins. J. & McKee, C. (2015) Vision Services for Children on Medicaid: A Review of EPSDT Services. National Health Law Program. Retrieved from http://www.healthlaw.org/issues/child-and-adolescent-health/vision-screening-epsdt#.WRNUzlPytTY
[8] Pascoe, J.M., Wood, D.L., Duffee, J.H., & Kuo, A. (2016) Mediators and Adverse Effects of Child Poverty in the United States. American Academy of Pediatrics. Retrieved from http://pediatrics.aappublications.org/content/early/2016/03/07/peds.2016-0340
[9] Jackson, C. K., Persico, C. & Johnson, R. C. (2015) Boosting Educational Attainment and Adult Earnings, Education Next 15(4) Retrieved from http://educationnext.org/boosting-education-attainment-adult-earnings-school-spending/
[10] Ibid.
[11] An audit by Phi Delta Kappa concluded the Quality Core Curriculum did not align with national standards consistently and lacked rigor compared to other states. An audit of Georgia Performance Standards, which replaced them, concluded the new standards were more rigorous. The GPS standards are incorporated in the Georgia Standards of Excellence. See Phi Delta Kappa International. (2004) A Preliminary External Curriculum Audit of the Georgia Performance Standards. Bloomington, IN: author. Retrieved from http://www.senate.ga.gov/sro/Documents/AtIssue/atissue_June13.pdf and Greer. L. (2013) At Issue: Common Core Standards. Georgia State Senate Research Office. http://www.senate.ga.gov/sro/Documents/AtIssue/atissue_June13.pdf
[12] For an overview of methodologies used to conduct cost of adequacy studies, see Baker, B. D., Taylor L. & Vedlitz A. (n.d.) Measuring Educational Adequacy in Public Schools. Retrieved from http://bush.tamu.edu/research/faculty/TXSchoolFinance/papers/MeasuringEducationalAdequacy.pdf.
[13] Duncombe, W. (2006) Responding to the Charge of Alchemy: Strategies for Evaluating the Reliability and Validity of Costing-Out Research, Journal of Education Finance 32(2), 137-169.


