This guide is designed to provide a demographic snapshot of Georgia’s colleges at the outset of the 2017-2018 school year, with insight into the forces that shape Georgia’s approach to higher education policy. This booklet documents the various needs filled by Georgia’s colleges, from urban research universities to rural technical schools. You’ll find it is rich with facts and figures to help you better understand the students enrolled in Georgia’s colleges, how Georgia funds higher education, as well as barriers to graduation.
Introduction: Higher Education Benefits People and Society
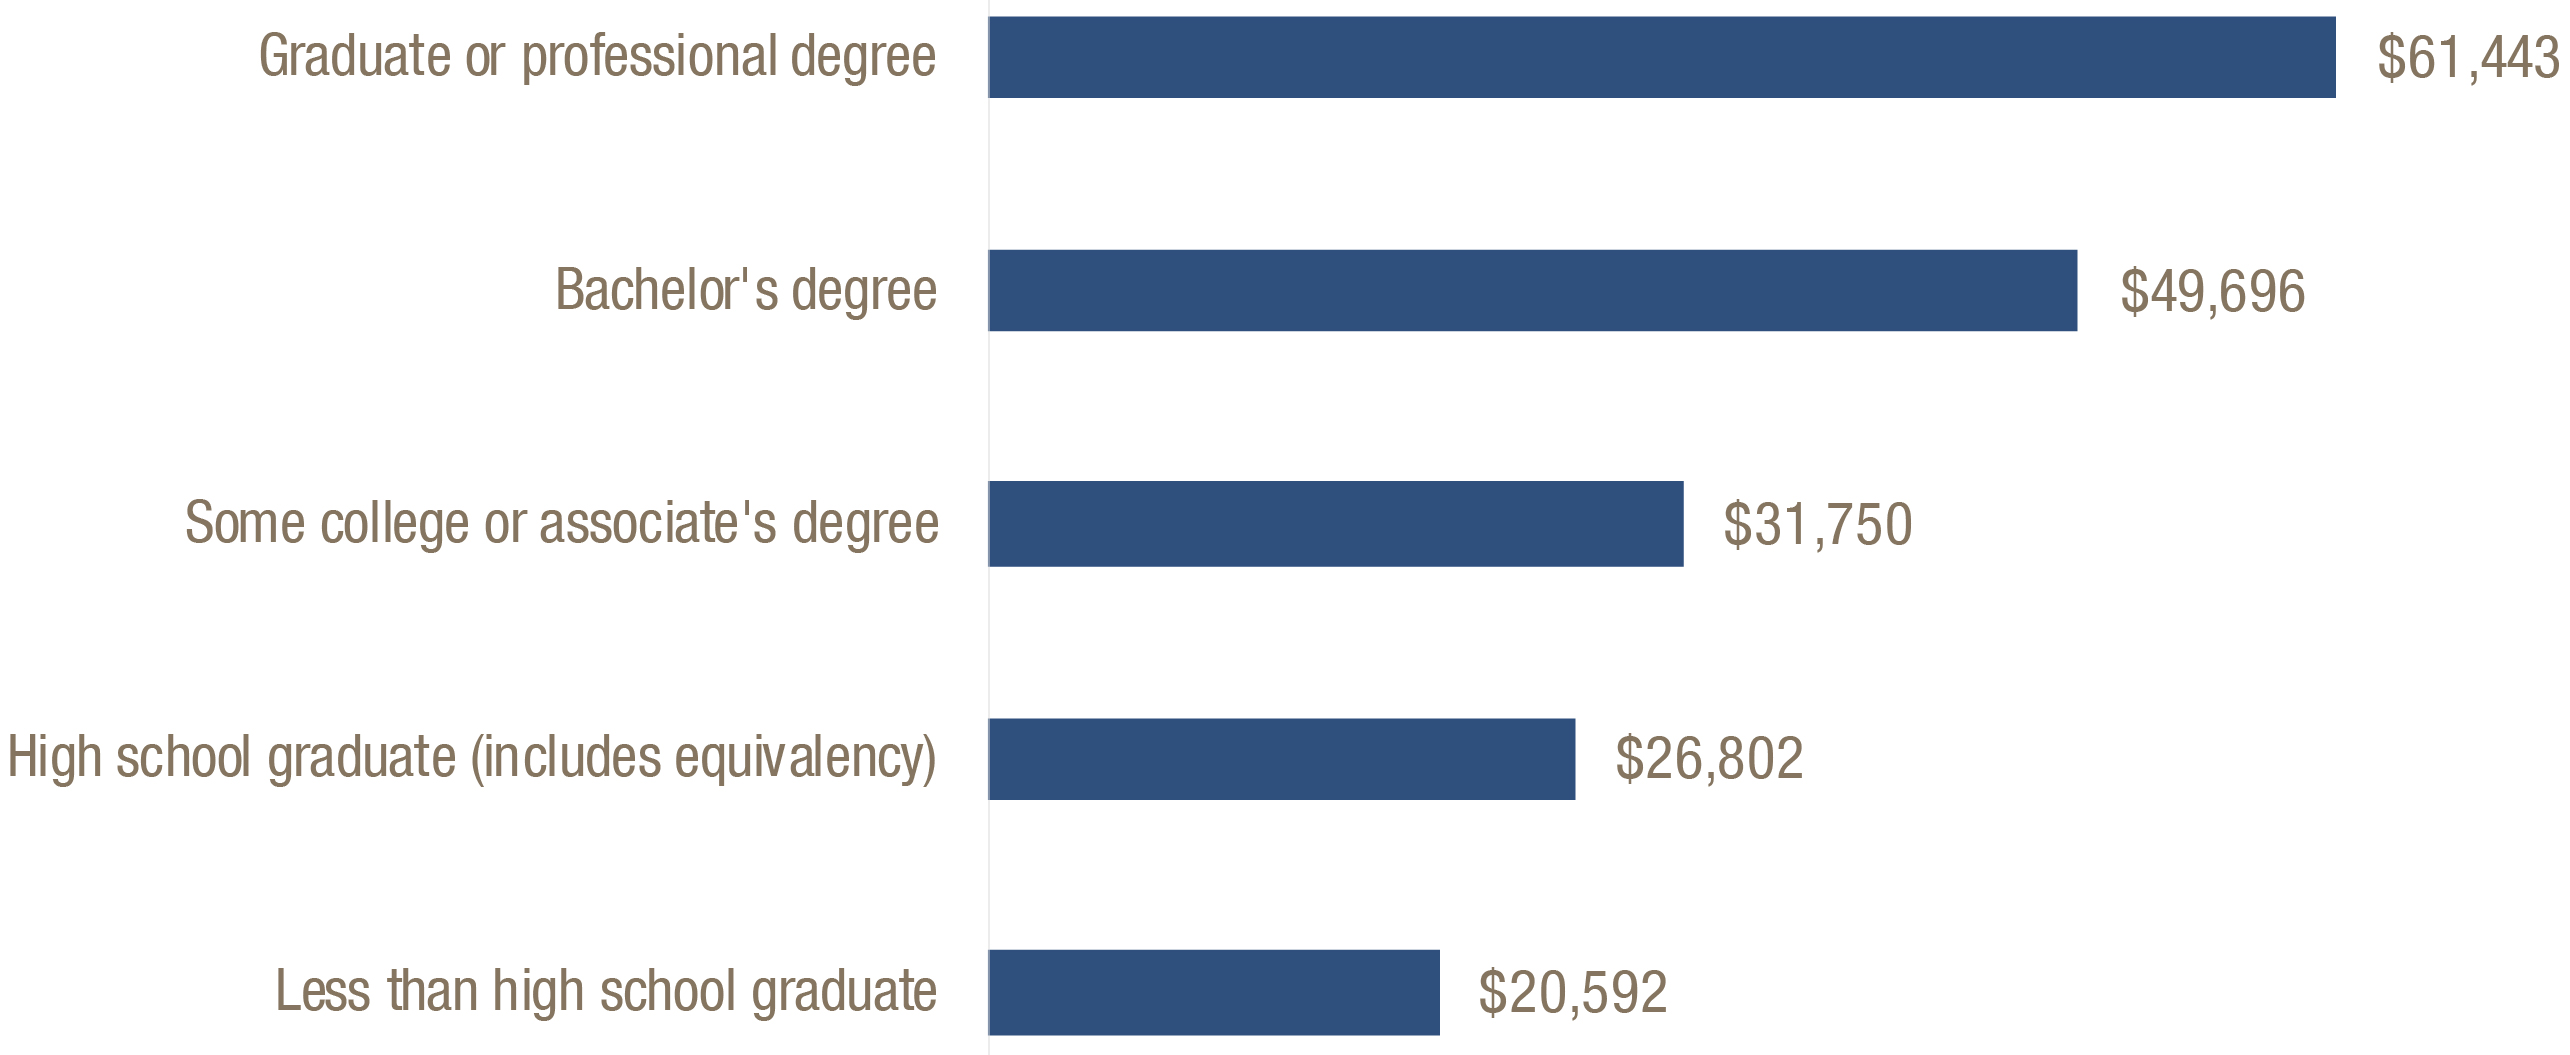
Higher education benefits the people who pursue it and society at large in many ways. In general, people can expect to earn more with each step up in education. High school graduates earn more than people without high school diplomas, associate’s degree holders earn more than high school graduates and people with bachelor’s degrees earn even more.[1]
Earnings Increase with Each Education Milestone
People with more education are also more likely to find work. The unemployment rate for Georgia workers with only a high school diploma was 6.9 percent, compared to 3.1 percent for those with a bachelor’s degree in 2015, the most recent year available.[2]
Workers with more education earn more. Higher earnings combine with better health and lower likelihood of involvement with the criminal justice system to provide a good return when government invests in higher education. Public spending on higher education is significant. Still, future gains in tax revenue and cost savings more than make up for the investment in the long run.
Workers with more education and higher earnings pay more taxes during their lifetime, are less likely to rely on Medicaid or other public services and are less likely to wind up in jail. One study estimates a public college degree delivers an average lifetime net benefit for federal, state and local governments of $481,000.[3]
Higher education is key to help students from lower-income families become middle- or high-income adults. When students from low- and high-income families attend the same college, they earn similar salaries post-college. College helps level the playing field for students of different socioeconomic backgrounds.[4]
Higher Education Essential to Building a Broad, Inclusive Middle Class
The vast majority of Georgians who want to join or remain in the middle class and live a financially stable life will need a postsecondary degree or credential at some point in their lives. Since the 1970s, unemployment rates worsened for people without any college education, while rates remained stable for Georgians with postsecondary education.[5] These trends accelerated after the recession. Since the recession’s peak in late 2009, 99 percent of new jobs have gone to workers with at least some college education, with the majority of jobs gains going to workers with a bachelor’s degree. Workers with only a high school diploma have experienced virtually no job recovery.[6]
Since the recession’s peak, 99 percent of new U.S. jobs have gone to workers with at least some college education
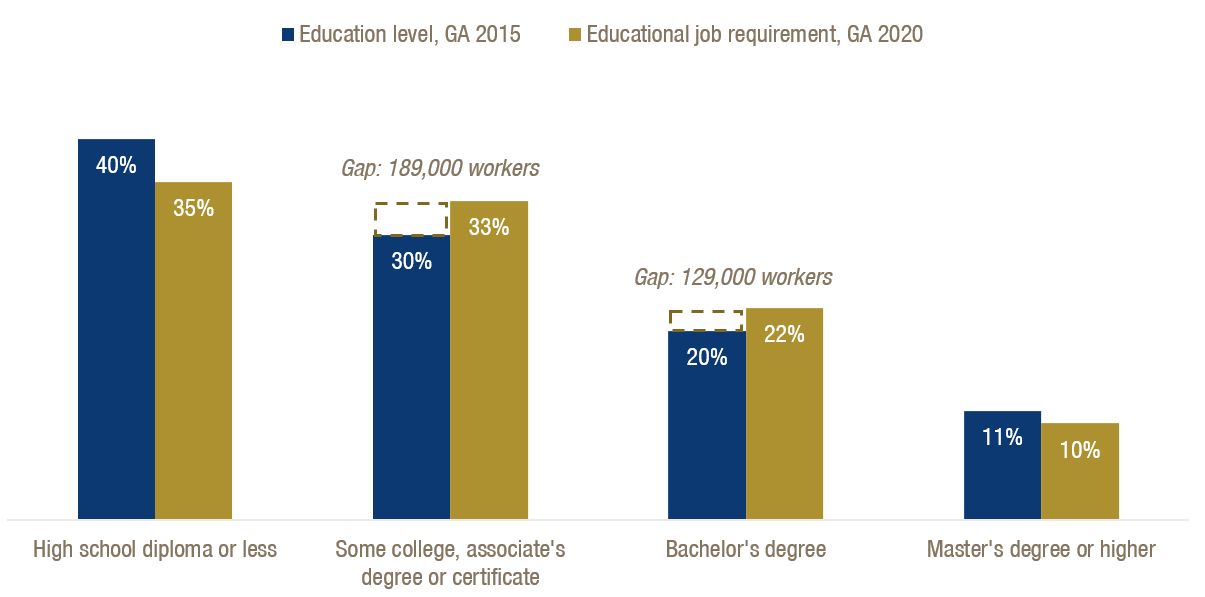
By 2020, 65 percent of Georgia’s jobs will require some level of postsecondary education and 22 percent will require a bachelor’s degree.[7] In 2015, Georgia produced fewer adults ages 25-64 with postsecondary credentials than needed. This leaves a gap of 189,000 workers with some college education, an associate’s degree or certificate, and 129,000 workers with bachelor’s degrees.[8]
Georgia Needs More Adults with Postsecondary Degrees
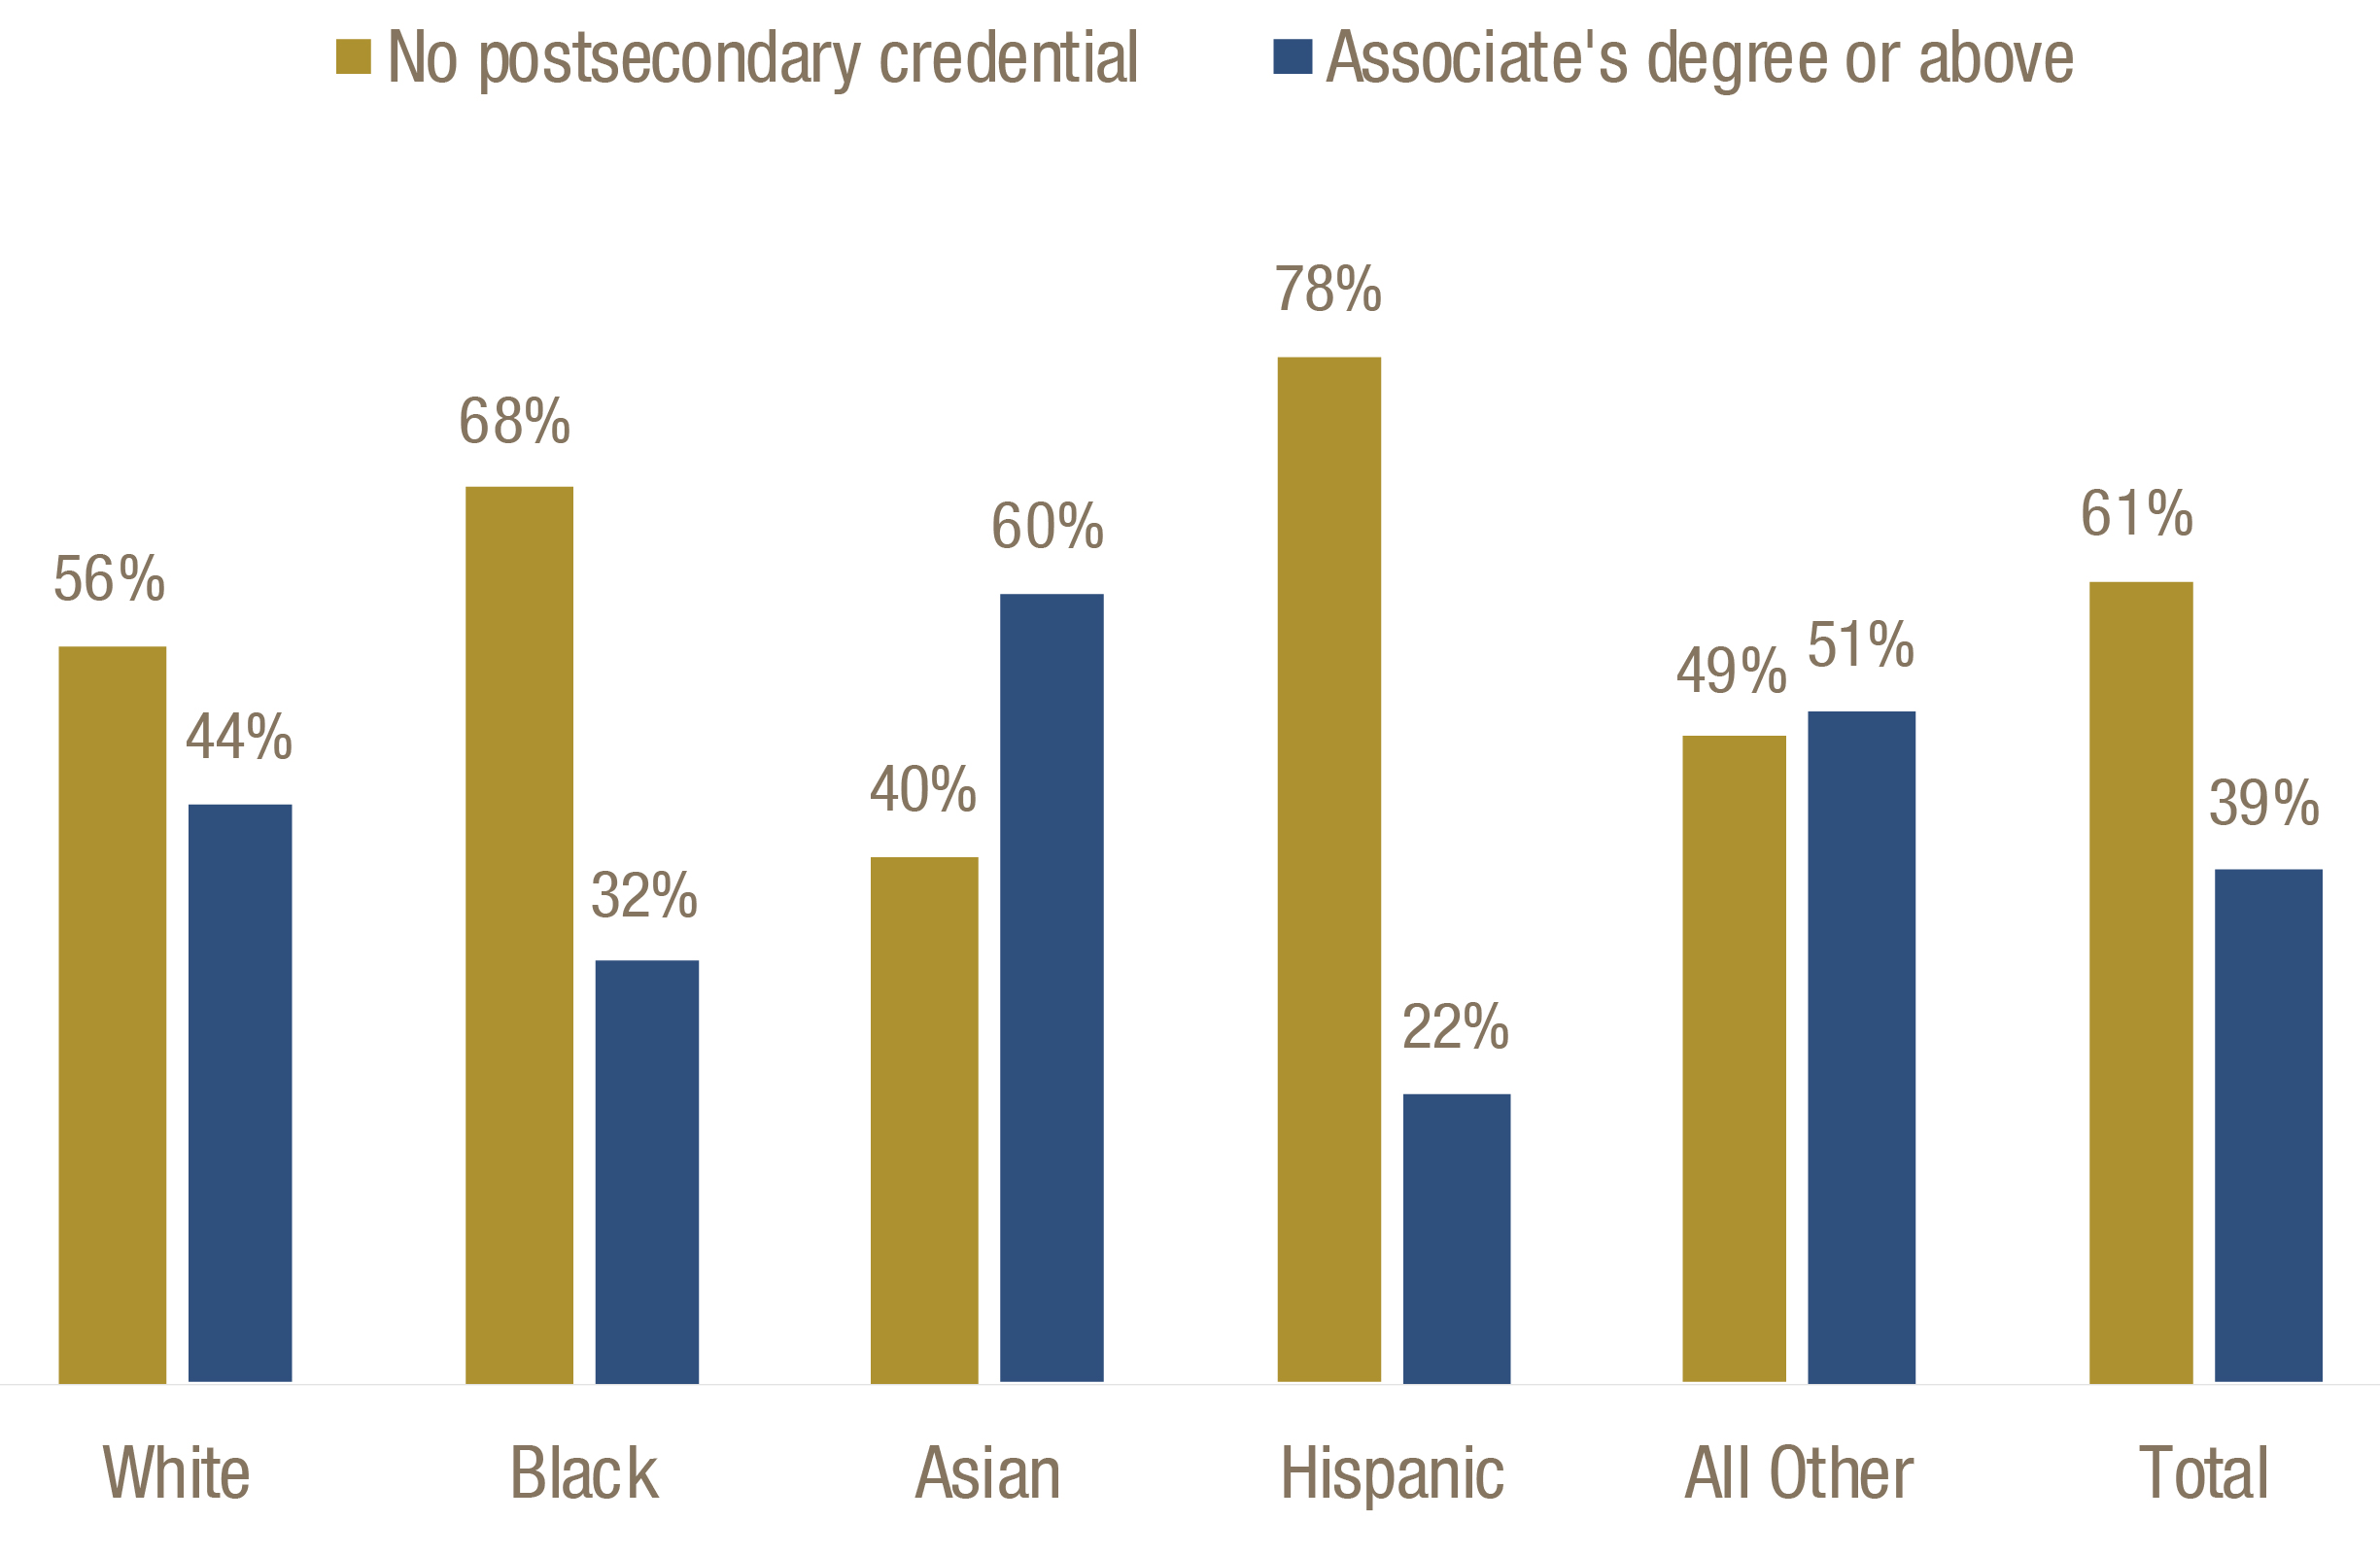
Large racial and ethnic disparities persist in postsecondary education achievement in Georgia. Hispanic Georgians are least likely to have an associate’s degree or higher. Fifty-six percent of white Georgians and 68 percent of black Georgians lack a postsecondary credential.[9]
As Georgia’s population grows more diverse along racial and ethnic lines, continued disparities could weaken the state’s ability to meet employers’ workforce needs. Black and Hispanic people will account for an estimated 56 percent of Georgia’s population by 2050.[10]
Gaps in Postsecondary Education Differ by Race and Ethnicity
Georgia’s Public Higher Education System at a Glance
Georgia boasts the longest tradition of public higher education in the United States. The state chartered the country’s first public university in 1785, the University of Georgia, “for the more full and complete establishment of a public seat of learning in this state.”[11]
Public higher education in Georgia includes a total of 50 institutions across the university and technical college systems. The two systems combine to educate more than 450,000 students across diverse programs of study, including technical certificates, associate’s degrees, bachelor’s degrees and graduate credentials.
Georgia’s public colleges and universities provide a diverse range of choices to students. Education options range from shorter-term programs designed to develop specific work skills, such as accounting or veterinary technology, to an undergraduate liberal arts education, to doctoral research.
University System of Georgia: One System, a Variety of Missions
The university system includes 28 public colleges and universities with multiple missions and institution types. Georgia’s colleges and universities fall into four classifications:[12]
- Research universities: Doctoral-granting institutions with high research activity
- Comprehensive universities: Significant research activity, but with less emphasis than at research universities; graduate programs are masters-dominant
- State universities: Primarily undergraduate and masters-level programs
- State Colleges: Associate’s degrees and bachelor’s degrees in select programs; no graduate programs
In fall 2016, 321,551 students enrolled in a university system school. Most of them enrolled in research universities and the smallest share took classes at state colleges. Research universities tend to have the largest student population and state colleges the smallest.
Full-time enrollment is highest in research universities and lowest in state colleges. State college and state university students are more likely to be women, attend part-time, live in rural counties and need financial help.[13]
| Number of Institutions | Enrollment | % Full-Time | % Women | % Students from Rural Counties | % Undergrads with Pell Grant | |
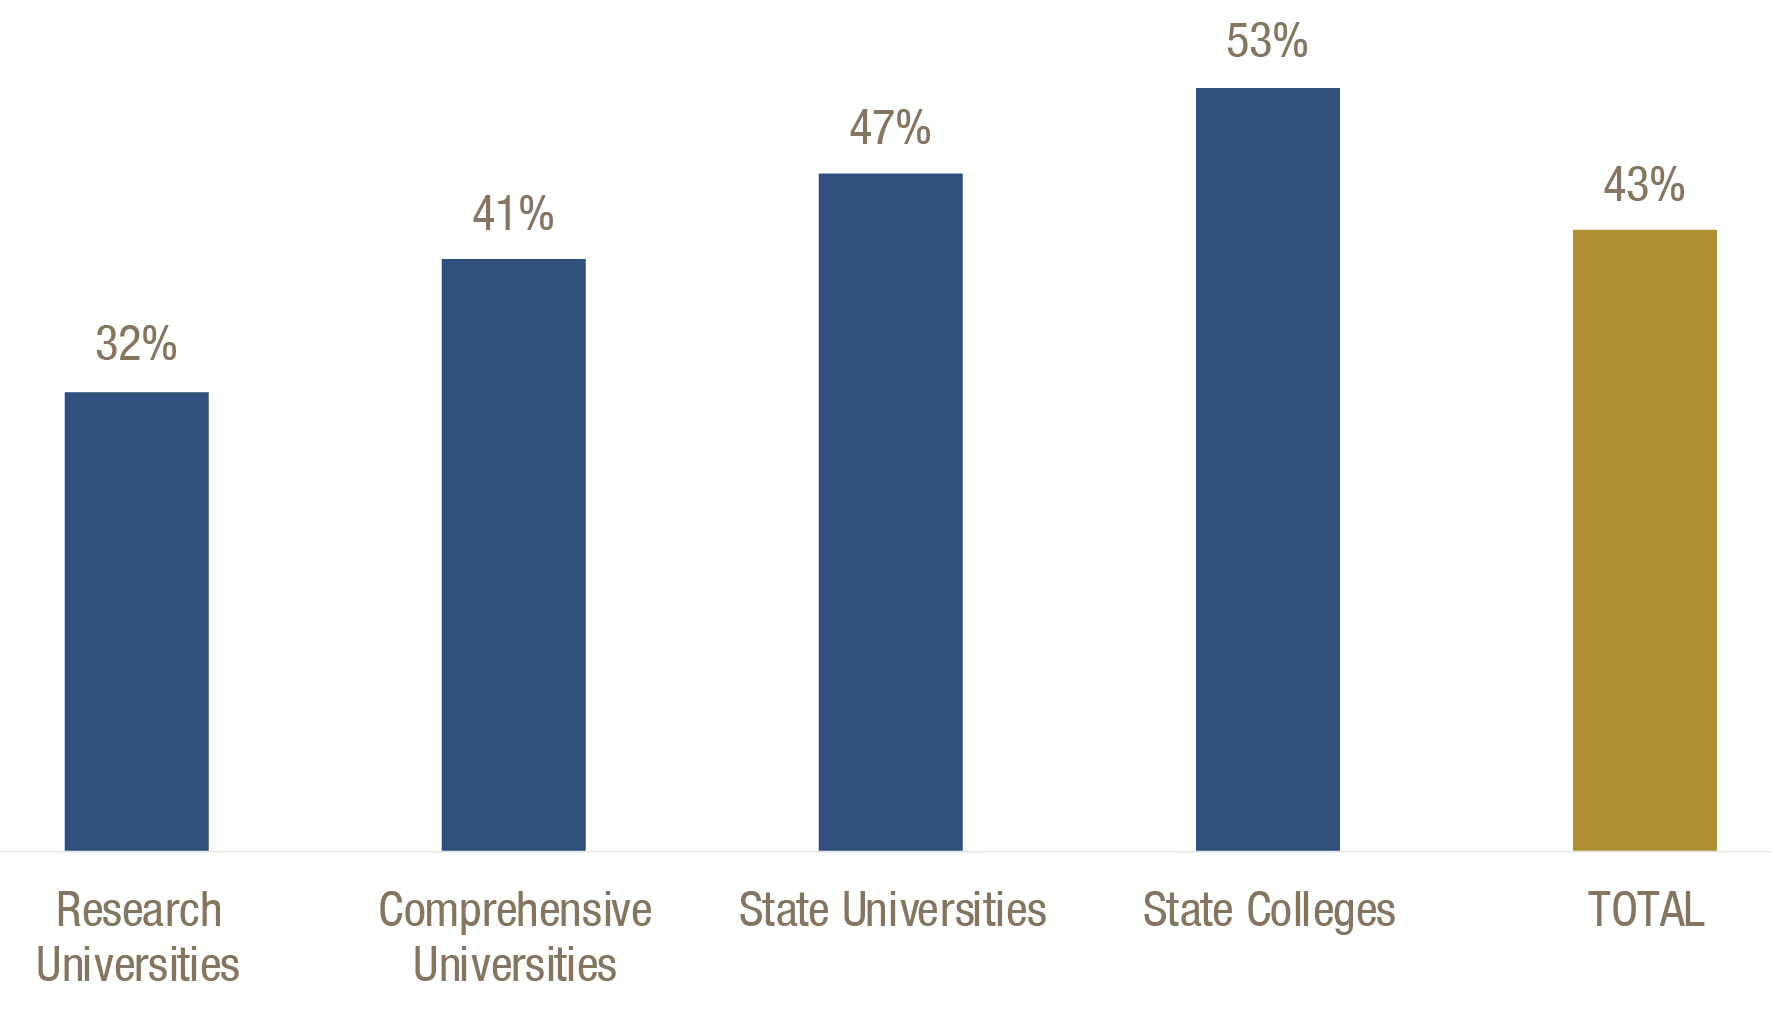
| Research Universities | 4 | 122,916 | 74% | 53% | 8% | 32% |
| Comprehensive Universities | 4 | 80,375 | 75% | 55% | 14% | 41% |
| State Universities | 10 | 69,037 | 70% | 61% | 22% | 47% |
| State Colleges | 11 | 49,223 | 59% | 62% | 24% | 53% |
| Total | 29 | 321,551 | 71% | 56% | 15% | 43% |

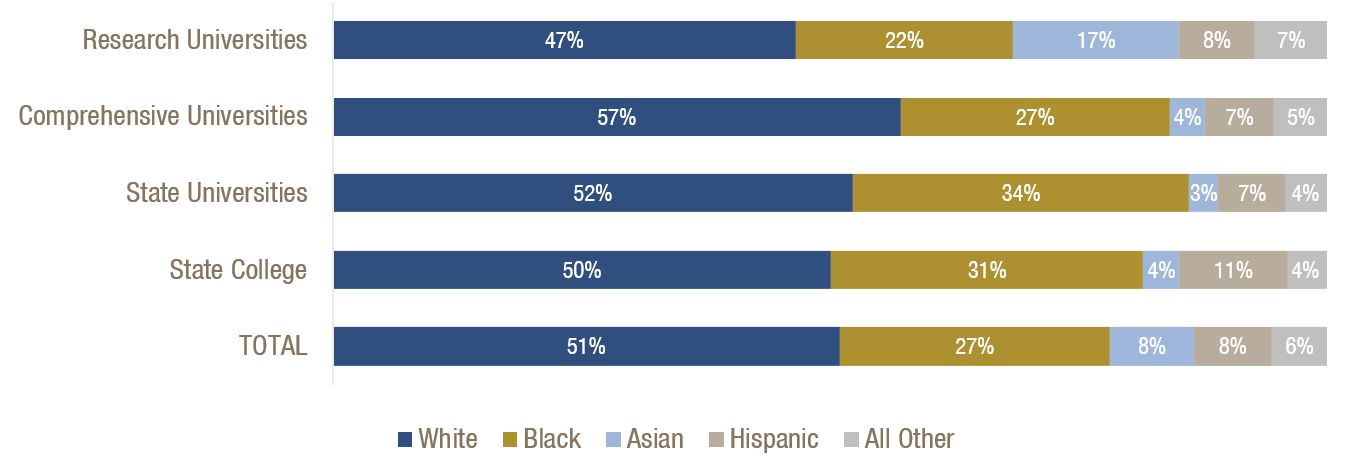
The racial and ethnic diversity of Georgia’s college students nearly matches the state’s population. Nearly half of university system students are black or Hispanic, a stark contrast with Georgia’s past.
Forty years ago, 83 percent of university system students were white, a much larger proportion than in the state’s population. Student body diversity varies among the institution types. Black students account for 34 percent of enrollment at state universities but only 22 percent at research institutions.[14] State universities include three historically black colleges or universities originally established to educate black students who lacked access to other institutions. They are Albany State, Fort Valley State and Savannah State universities.
University system students are racially and ethnically diverse across institution type
Georgia’s public college and university students often rely on federal financial aid. At Georgia Tech, about 16 percent of students rely on the federal Pell Grant, while 51 percent at Georgia State do. At Georgia College & State University, 20 percent of students receive the Pell Grant, compared to 78 percent at Fort Valley State University. State colleges charge the lowest tuition rates in the Georgia and enroll a larger share of low-income students.[15]
Student Financial Need is Highest in State Colleges
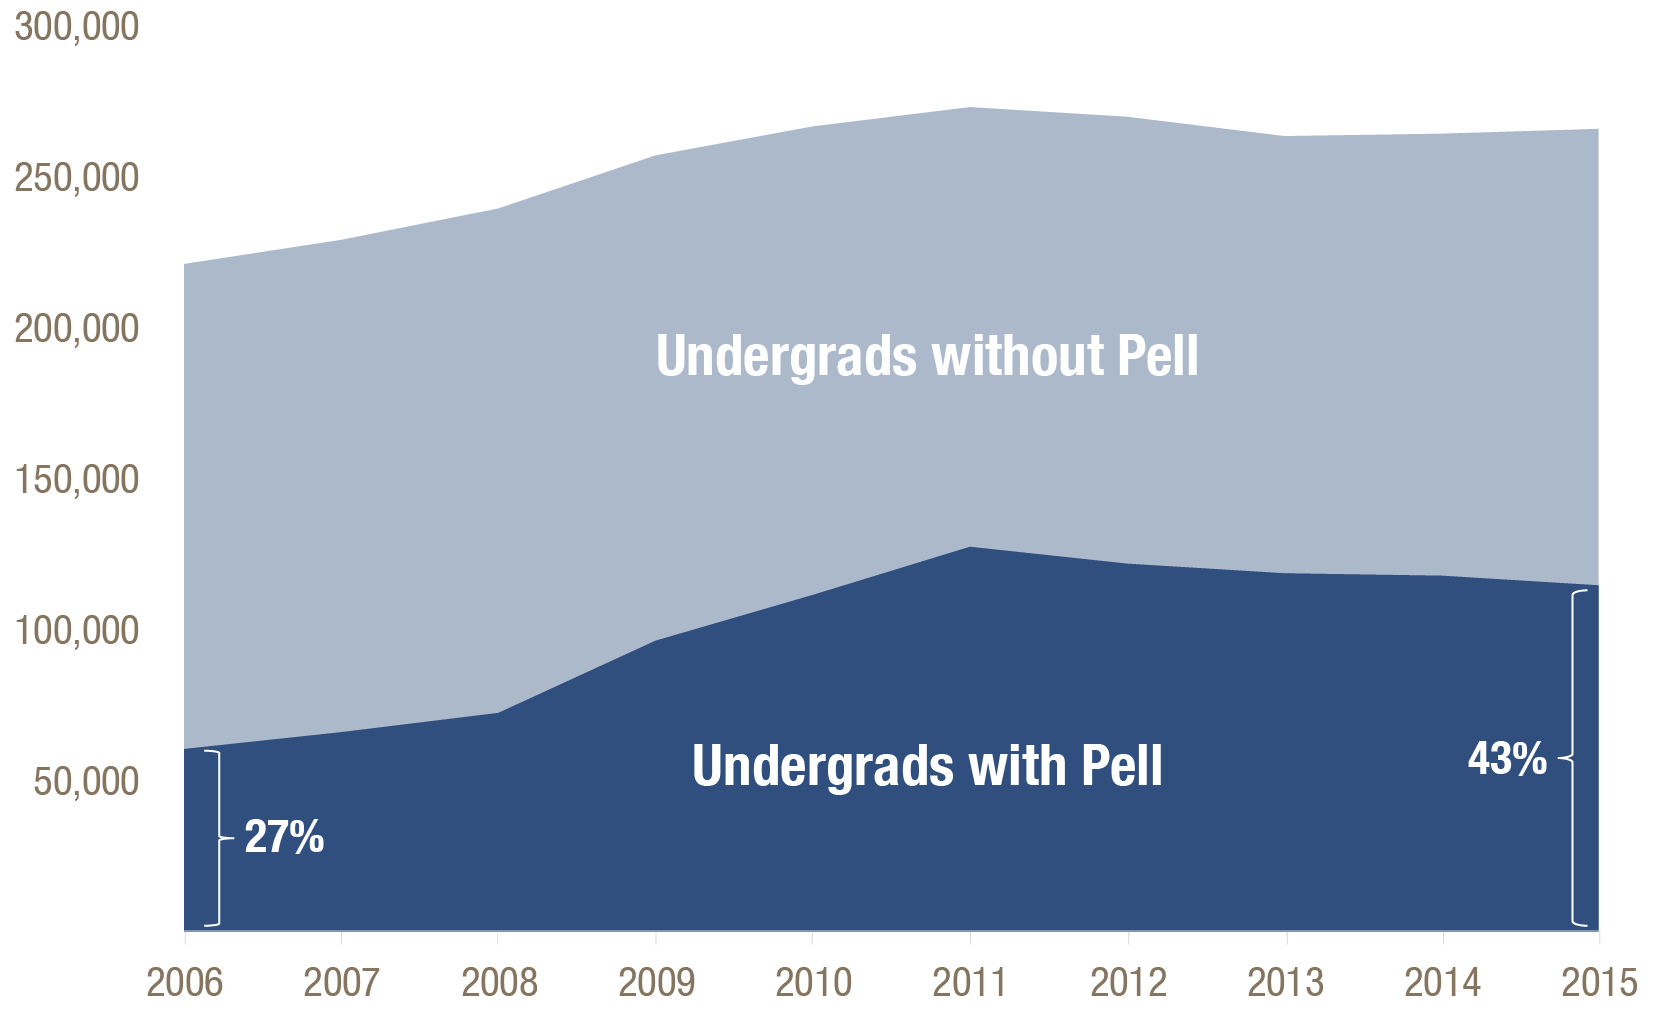
The recession that began in 2007 increased need for financial aid. Need remained high, even as the economy rebounded. Low-income students are now a larger share of total university enrollment due to lingering effects of the recession and increased enrollment by students from low-income families. The percentage of students in Georgia who qualify for the Pell Grant increased in the past 10 years from 27 to 43 percent.[16]
Nearly Half of University System Students Qualify for Financial Help
Technical College System of Georgia: A Workforce Safety Net
The technical college system provides job-focused instruction in addition to adult education and workforce training. It includes 22 technical colleges with 85 campuses throughout the state and one technical division of a university system state college.
Total Georgia technical school enrollment reached 133,455 in 2016, higher than in Georgia’s research universities. Sixty-two percent of technical college students are women.[17] Seventy percent attend part-time.[18] Technical colleges serve students that are diverse in race, ethnicity, age and income.
Although nearly all technical colleges serve both rural and urban areas of Georgia, a third of Georgia’s technical colleges serve predominately rural areas. Technical colleges serve a larger share of adult and low-income students than the university system.[19]
| Number of Colleges | Colleges serving predominantly rural areas | Enrollment | % Full-Time | % Women | % Students with Pell Grant | |
| Technical Colleges | 23* | 8 | 133,455 | 30% | 62% | 52% |

Technical college students are from diverse ethnic and racial backgrounds. About half of students are white, and 40 percent are black. Hispanic and black students make up a slightly higher share of students at technical colleges than in the university system.[20]
White and Black Students Are Majority of Georgia’s Technical College Enrollment

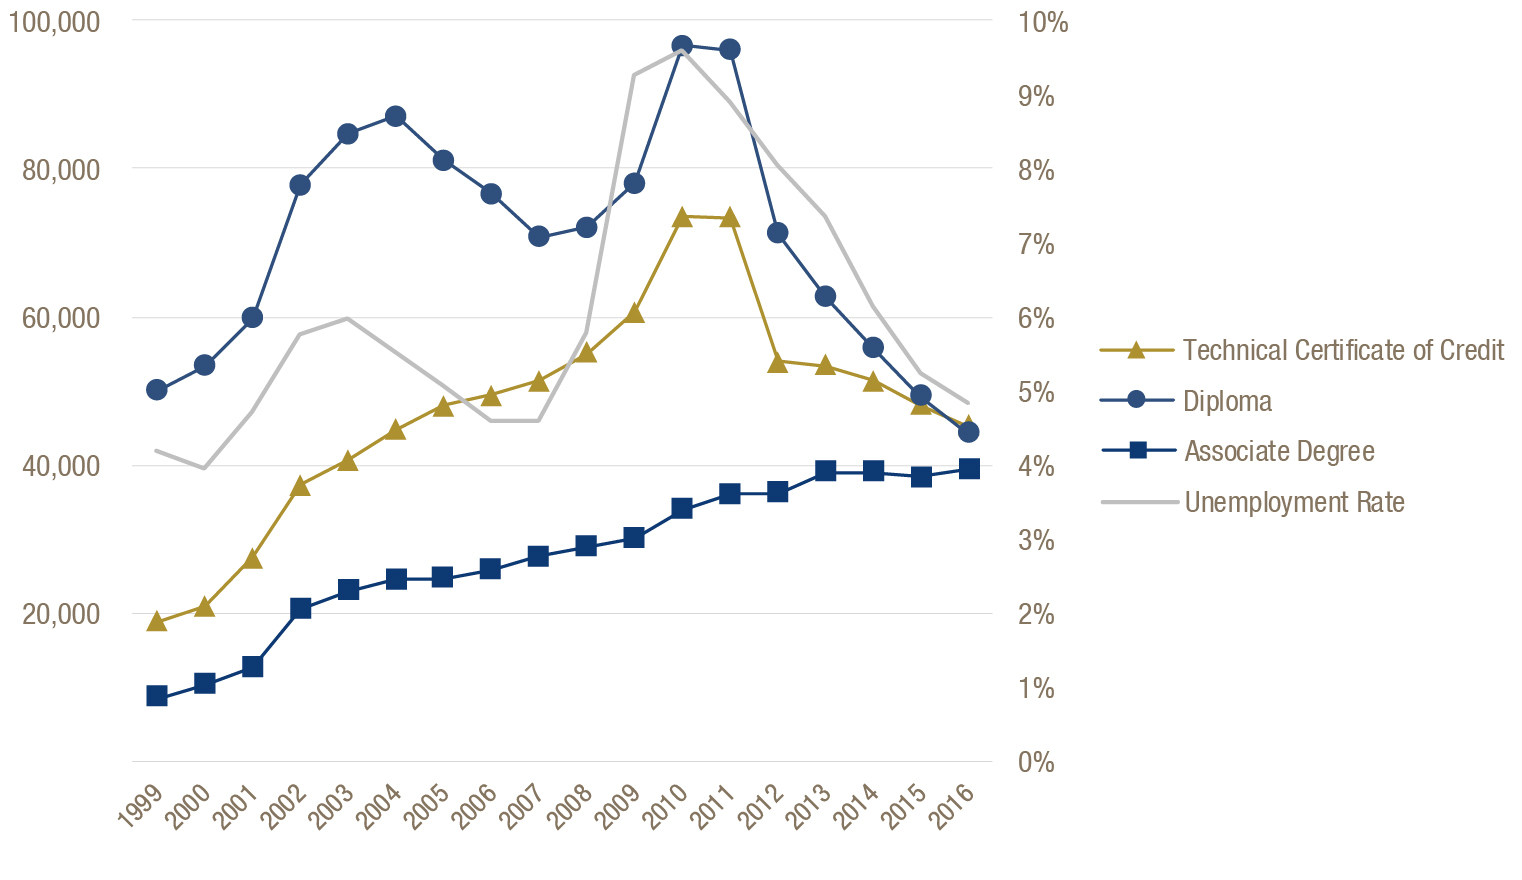
Technical education enrollment is sensitive to changes in the economy. When unemployment is high, displaced workers who want to upgrade their skills often enroll in technical colleges. Technical colleges offer three types of program awards: technical certificates of credit, diplomas and associate’s degrees. Certificates are generally the shortest to complete and associate’s degrees take longest.
Enrollment in diploma and certificate programs increased dramatically during the recent recession and dropped steeply after 2011. Enrollment in associate’s degree programs continues to increase steadily.[21]
Technical College Certificate and Diploma Enrollment Tracks Economic Cycles
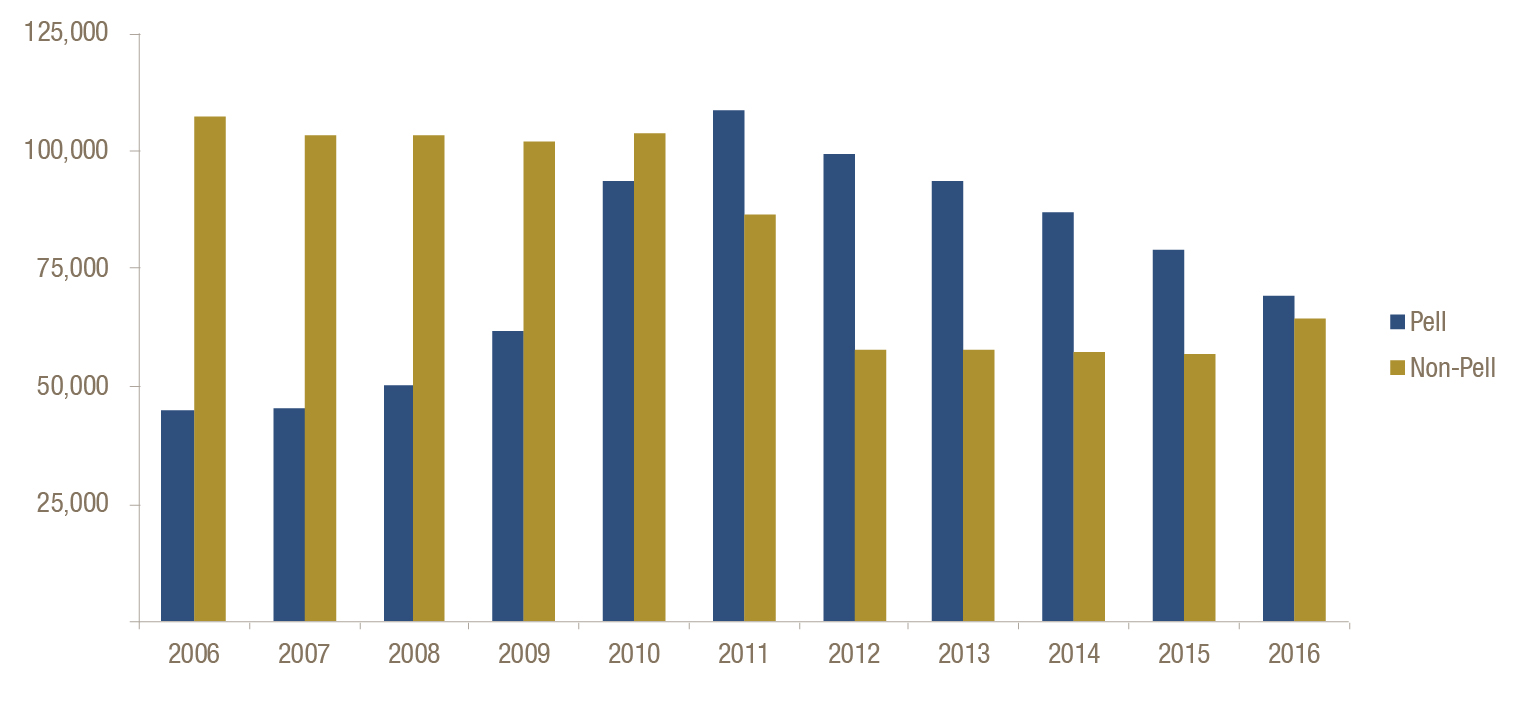
The recession also rapidly increased both the number and share of technical college students receiving the Pell Grant. The number of students receiving Pell decreased as the economy recovered. Still, most technical college students received the Pell Grant in 2016.[22]
Technical College Students with Financial Need Spiked Due to the Recent Recession
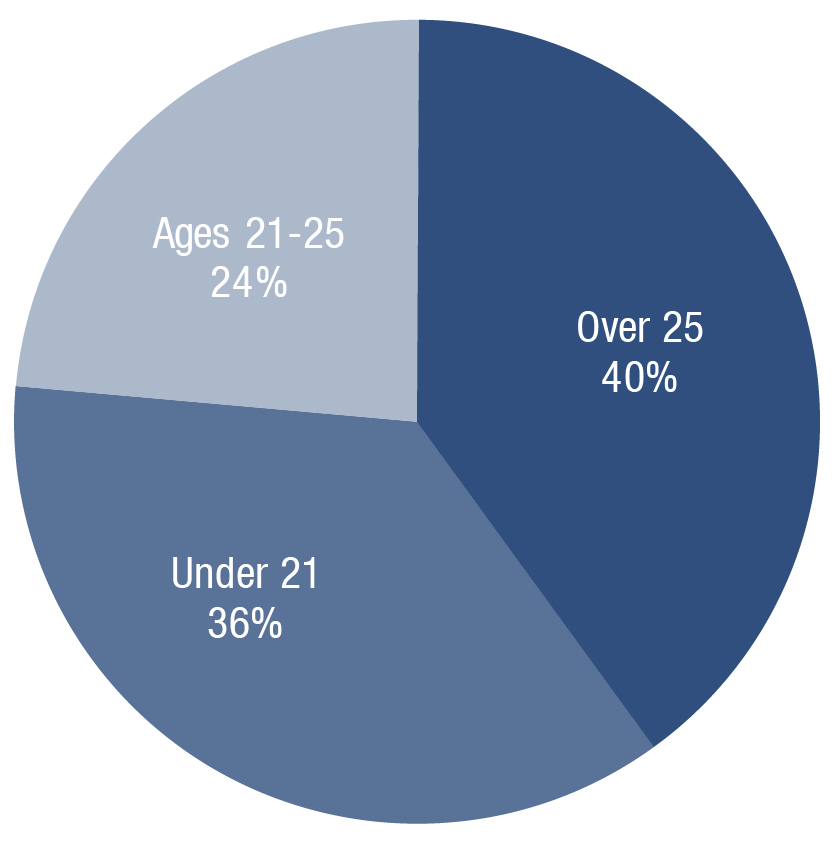
Technical colleges always served a large share of older students. The economic downturn dramatically increased the enrollment of students older than 25, though enrollment in this age group has decreased as job opportunities improve. Enrollment of students under age 21 grew the past couple of years, bolstered by high school students participating in the dual-enrollment Move On When Ready program.[23]
Georgia’s Technical Colleges Serve More Older Adults
University of Georgia Institutions
Research Universities
State Universities
|
Comprehensive Universities
State Colleges
|
Source: Board of Regents, University System of Georgia; *Georgia State University carries out a secondary function as a state college
State Funding for Higher Education
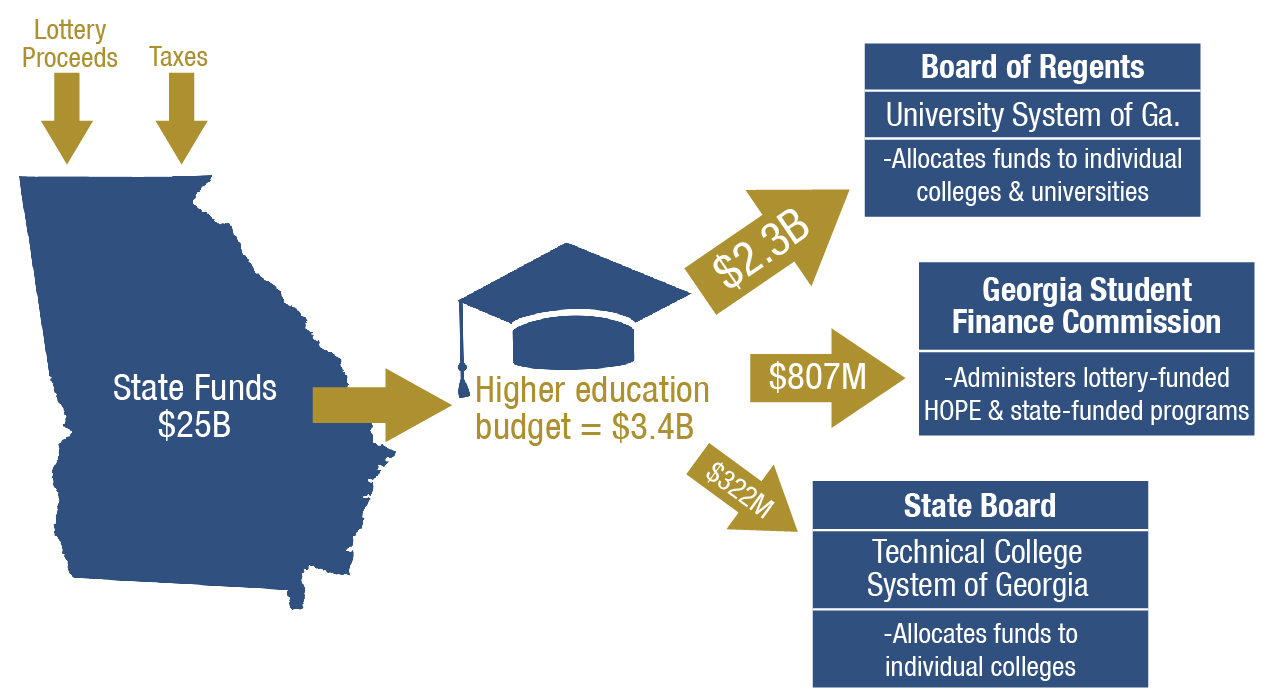
Georgia taxpayers contribute billions of dollars to higher education each year. Higher education is largely paid for through the state’s general fund, which is made up of revenues from personal and corporate income taxes and the state sales tax. HOPE scholarships and grants are funded through the state lottery. The state’s 2018 budget allots $3.4 billion for higher education, or 14 percent of total state funds. That percentage remained relatively stable over the past 10 years. Lottery proceeds are about one-fifth of total higher education spending.[24] Higher education spending in the state’s 2018 budget includes:
- $2.3 billion for the University System of Georgia
- $322 million for the Technical College System of Georgia
- $807 million for the Georgia Student Finance Commission, which includes lottery proceeds for HOPE
The state also budgeted $394 million from the state general fund to finance bonds for capital construction, equipment or renovations in the university and technical college systems.[25]
The state Legislature appropriates money in a lump sum to the boards of the university and technical college systems each year. The boards guide funding of individual schools. Research universities receive about 2.5 times the per-student state funding as other institutions. State colleges receive the lowest core revenues per student.[26]
Research universities receive about 2.5 times the per-student state funding as other institutions.
The University System of Georgia is governed by the 19-member Board of Regents. One member represents each of Georgia’s 14 congressional districts and five others are at-large. The board of the technical college system is made up of 23 members, one from each congressional district and nine others are at-large. The governor appoints all board members.
Georgia Funds Three Higher Education Agencies Through State Funds and Lottery Proceeds
State appropriations are historically the largest funding source for Georgia’s public colleges and universities. State funding levels declined steeply since the 1990s.[27]
Per-student Funding for the University System in Decline

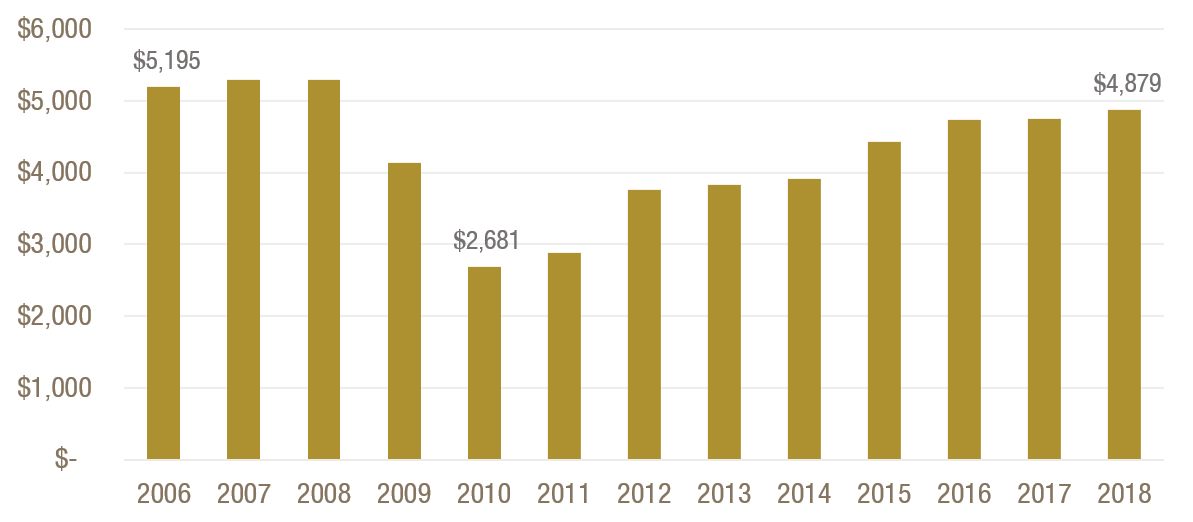
Technical colleges felt the brunt of the recession that started in 2007, as state funding fell and enrollment surged from displaced workers trying to upgrade their skills in technical certificate and diploma programs. As the economy improved, enrollment in technical colleges decreased. Per-student funding has now returned to pre-recession levels.[28]
Sharp Drop in Per-student State Funding for Technical Colleges During Recession
Recession-era cuts in state appropriations prompted schools to raise tuition and fees, which in turn increased state spending on HOPE programs. After two years of higher education budget cuts and tuition increases, spending on HOPE spiked in 2011.[29] The Legislature in 2011 cut the average amount of HOPE scholarships and grants.
Average HOPE Awards Grew During State Budget Cuts, Fell After 2011 HOPE Cuts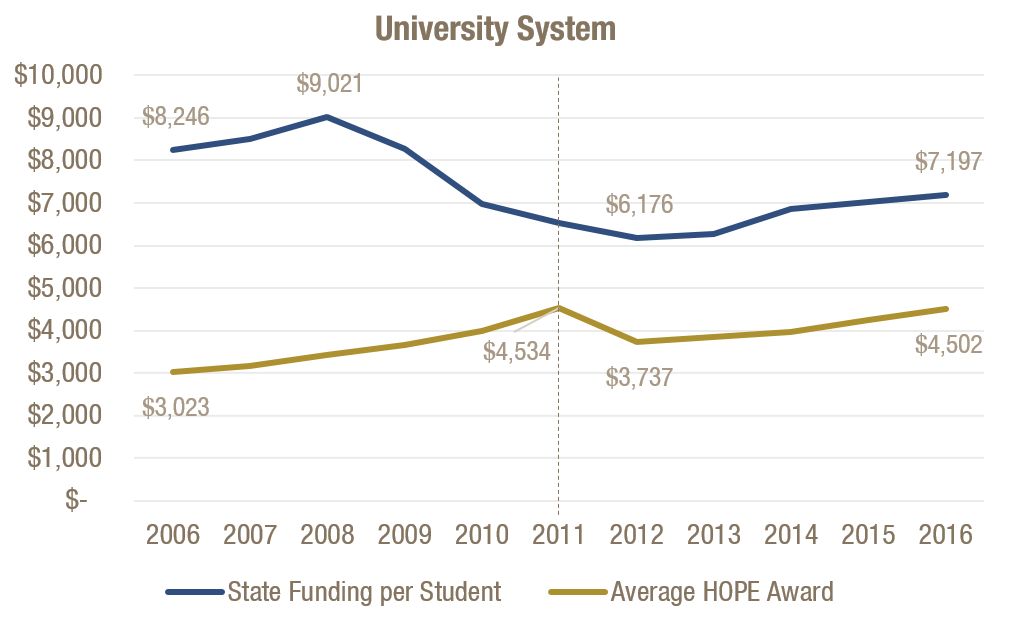


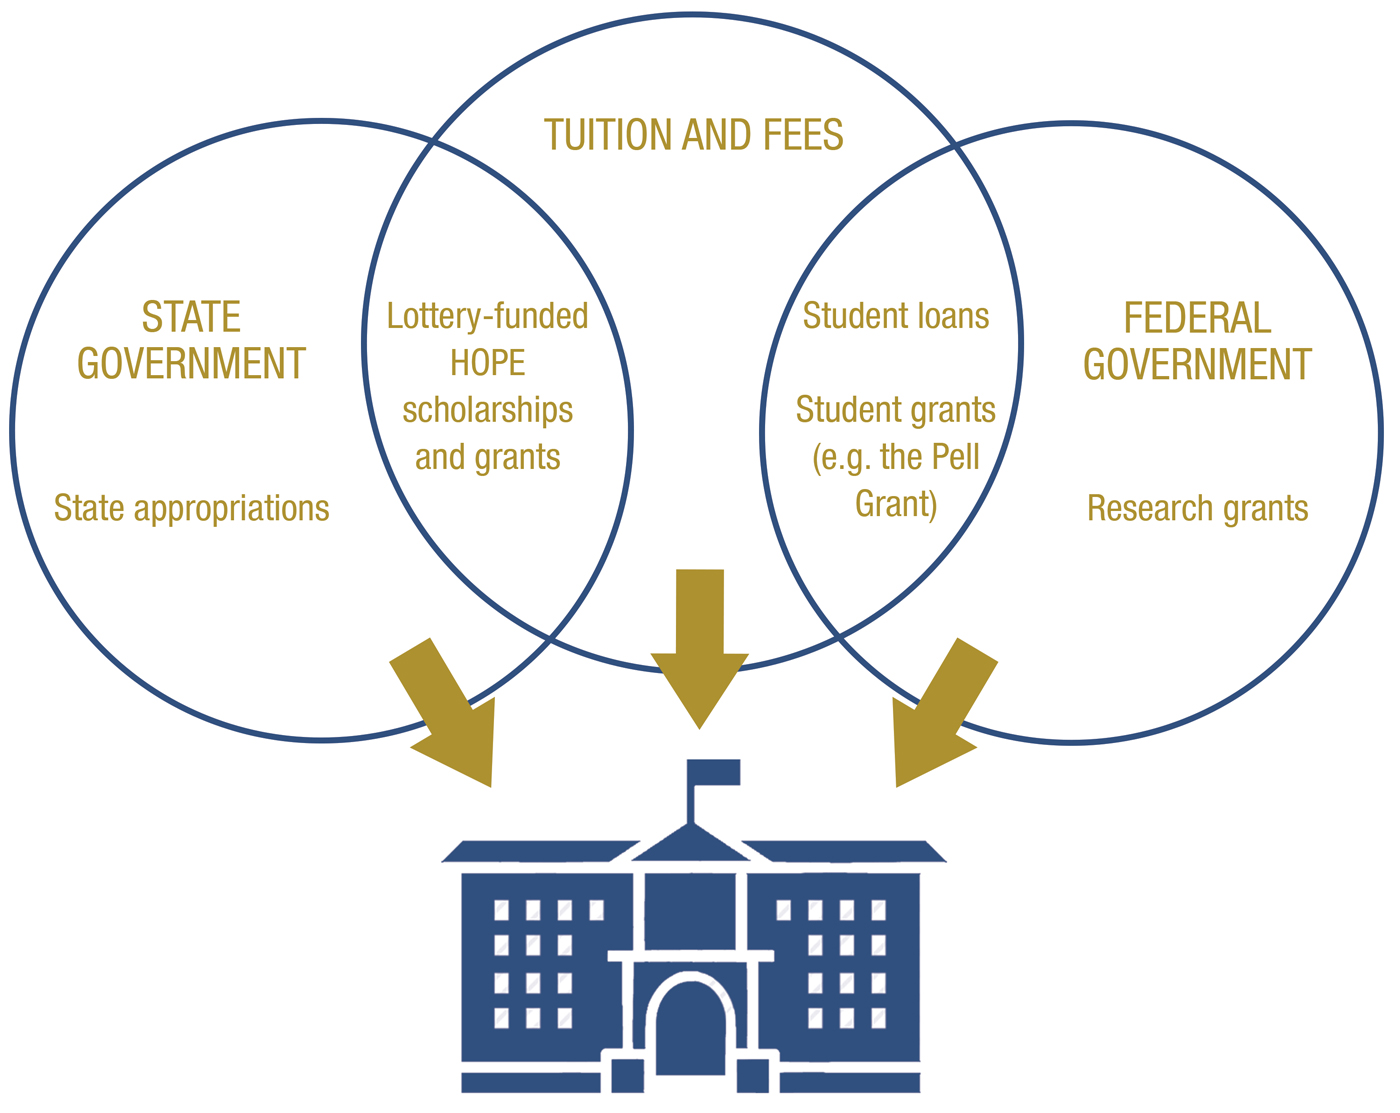
Georgia Colleges, Universities Supported by State Funding, Tuition, Fees and the Pell Grant
Georgia’s higher education institutions are funded directly by the state and indirectly through student financial aid, including federal loans, the Pell Grant and HOPE.
Colleges’ Revenues are State Funding, Federal Grants, Tuition and Fees
The long-term decrease in per-student state funding caused public colleges and universities to rely more on tuition, fees and federal grants. This translates into higher tuition and fees.
State funding was once the largest source of core revenues in the university and technical college system. Decreased state funding and increased reliance on tuition and fees in recent years means that balance is reversed at many schools.
States with larger percentages of low-income students are experiencing an increased reliance on the need-based federal Pell Grant to offset state funding declines.[30]
Colleges and Universities Increasingly Rely on Tuition and Fees
Percentage of core revenues by source, 2006-2015
Source: U.S. Department of Education, National Center for Education Statistics, Integrated Postsecondary Education Data System; GBPI analysis of Georgia public institutions, 2006 and 2015 revenue data; HOPE grants and scholarships are included in tuition and fees; federal grants include Pell Grants and other federal financial aid, percentages do not add up to 100 percent because smaller shares of revenue from other grants and contracts, private gifts, investment income and other sources
How Do Colleges and Universities Spend Money?The mix of higher education revenue sources changed a lot from 2006 to 2015, but spending patterns remained the same, according to a 2016 Georgia Department of Audits and Accounts report. The percentages of university system spending on functions such as instruction, student services and plant operations stayed relatively consistent from 2006 to 2015. Overall spending increased slightly, by approximately $890 per full-time student. The biggest reasons for this increase were expenses such as housing and dining services and athletics, which are funded by student fees. The majority of university system expenses remain faculty and staff salaries and benefits, though per-student spending on faculty and staff decreased from 2006 to 2015. |
HOPE Scholarships and Grants
Georgia appropriates money from lottery proceeds for HOPE scholarships and grants each year. The major HOPE programs are:
- HOPE Scholarship – Partial tuition for bachelor’s or associate’s degree programs at public and private colleges and universities
- Zell Miller Scholarship – Full tuition for bachelor’s or associate’s degree programs at public colleges and universities, partial tuition at private colleges
- HOPE Grant – Partial tuition for certificate or diploma programs in technical colleges
- Zell Miller Grant – Full tuition for certificate or diploma programs in technical colleges
- HOPE Career Grant – Partial tuition for specific certificate or diploma programs
Of the eligible bachelor’s and associate’s degree-seeking students in the university and technical college systems, 8 percent receive the Zell Miller Scholarship, 38 percent the HOPE scholarship, and 54 percent do not receive state aid through HOPE.[31]
Most Bachelor’s and Associate’s Degree Students Do Not Receive HOPE

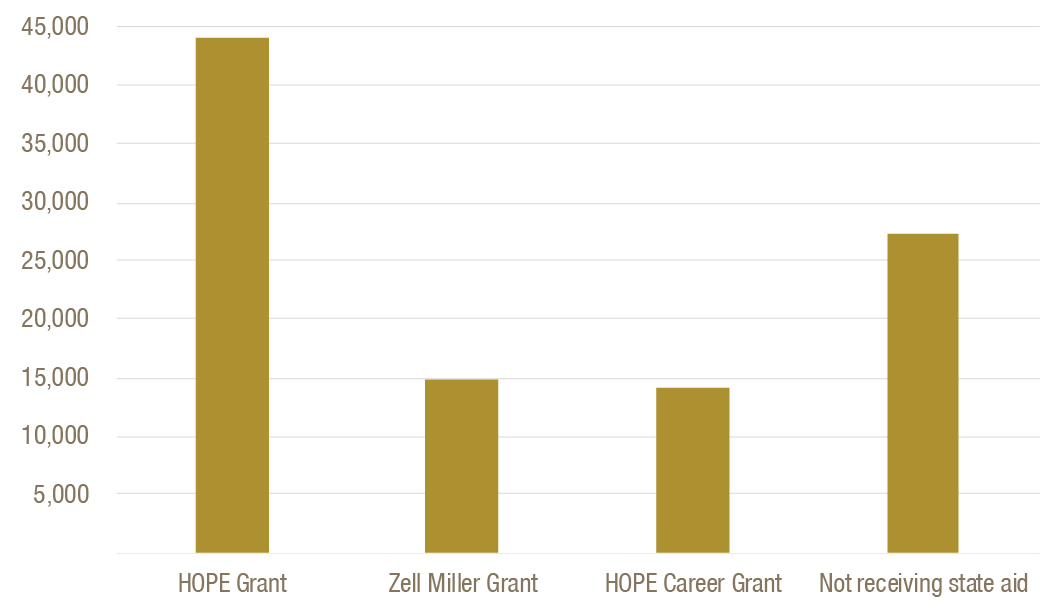
In contrast, most students in certificate and diploma programs in the technical college system do receive assistance through HOPE. Students can receive both the HOPE/Zell Miller Grant and the HOPE Career Grant, depending on program of study.
Most Certificate or Diploma Students in Technical College System Get HOPE Grants
Large racial, ethnic and income disparities exist among students who receive the full-tuition Zell Miller scholarships. Low-income students are much less likely to receive the scholarship than their middle and high-income peers. In fall 2013, 21 percent of Zell Miller recipients received the Pell Grant, compared to 44 percent of total university system students that year. Only 5 percent of Zell Miller Scholars were black, compared to 28 percent of total students. Nearly 80 percent of Zell Miller Scholars were white.[32]
79 percent of Zell Miller scholarship students come from middle or high-income families.
College Completion Rates Across Race, Ethnicity
and Income
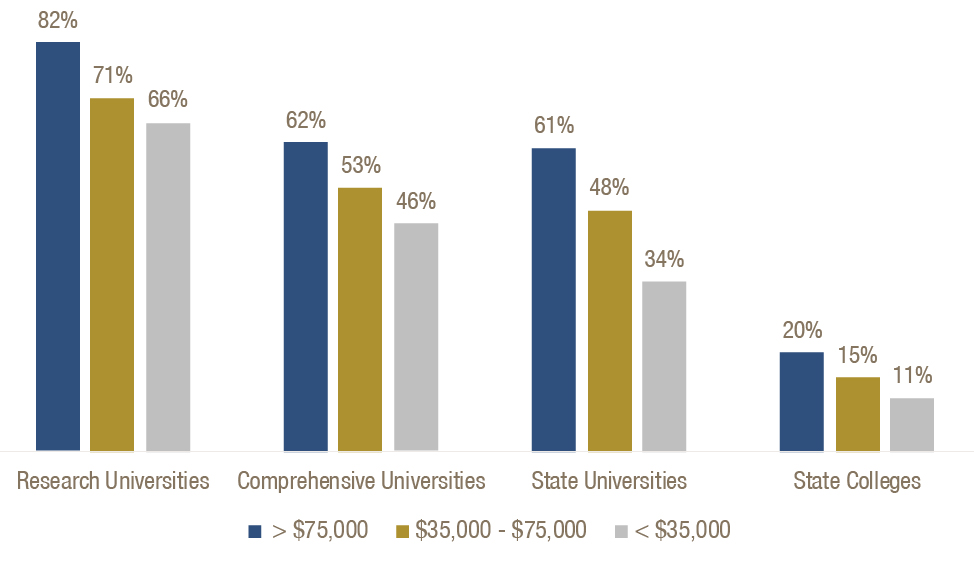
Policymakers are focused on boosting postsecondary education attainment and improving college completion rates. Large disparities in completion rates exist among schools and by students’ income, race and ethnicity. Lower completion rates for students are found at state colleges and among low-income and black students.[33]
Students in State Colleges and Low-income Students Face Highest Graduation Barriers
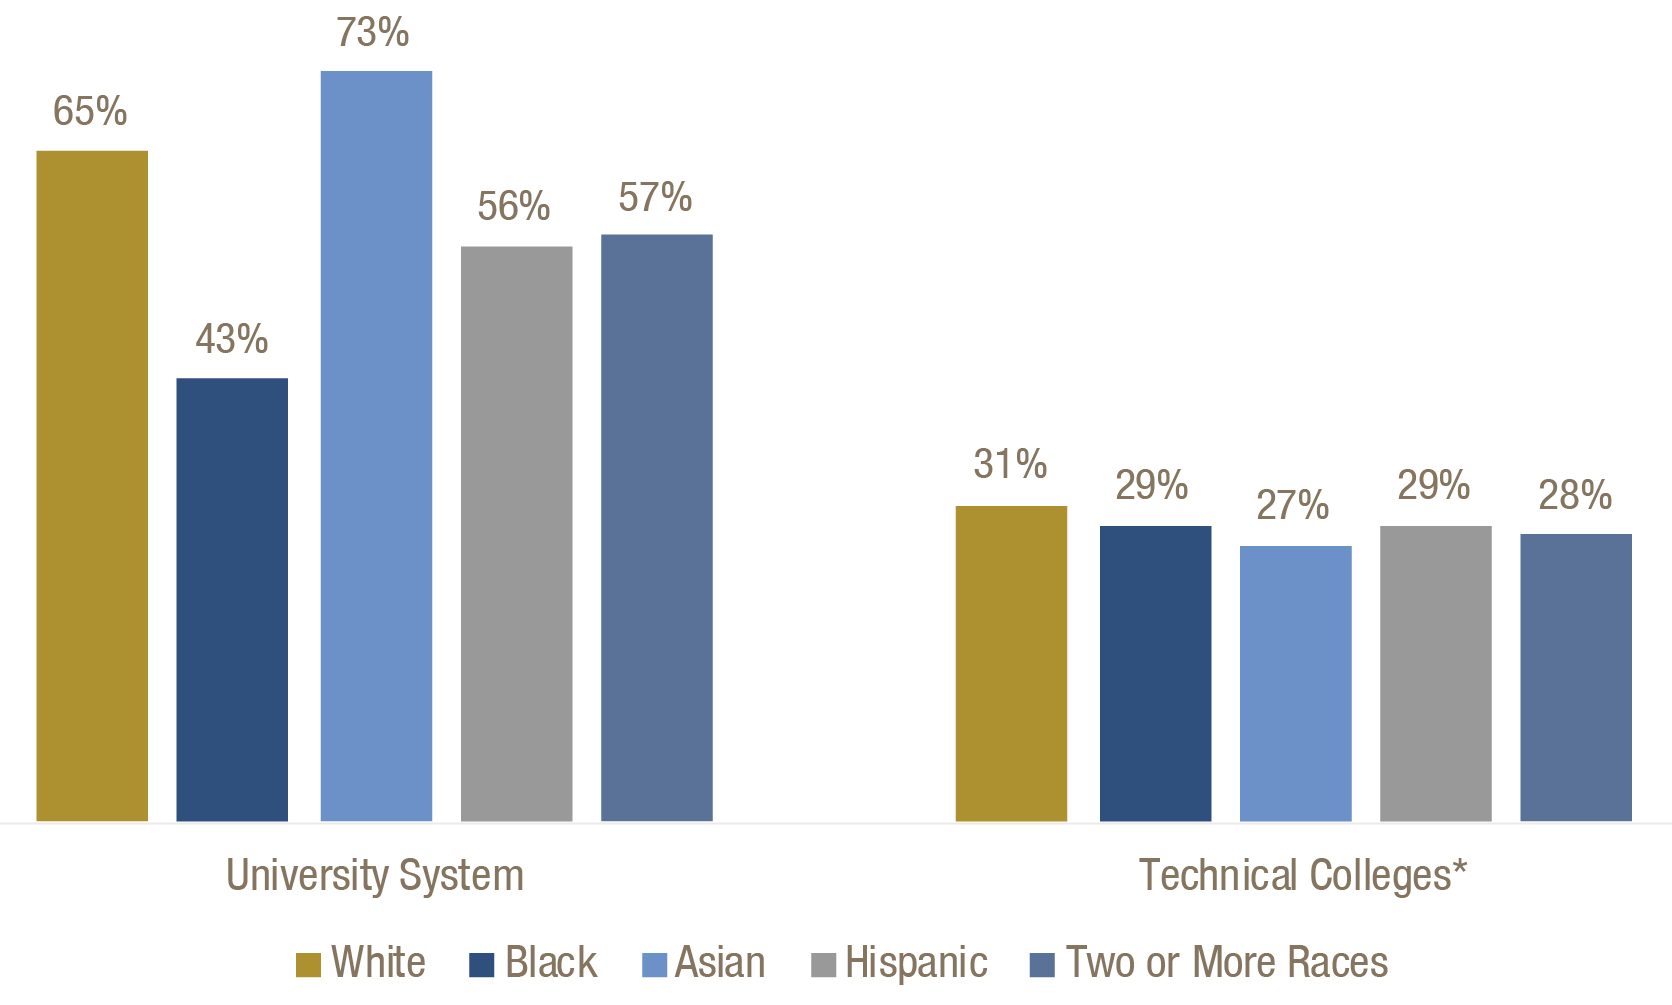
Black students face the highest barriers to graduation in the university system. In the technical college system, completion rates are lower but constant among racial and ethnic groups.[34] Low completion rates among lower-income and black students are made more worrisome as they become a larger share of higher education students.
Forty-three percent of undergraduate students in the university system and 52 percent of technical college students qualify for the Pell Grant.[35] Black students make up 27 percent of university system students[36] and 40 percent of technical college students.[37]
Georgia Struggles to Graduate University System’s Black Students
Conclusion
Georgia’s higher education system is the critical link between Georgians and job opportunities. Colleges and universities are incubators for the state’s future workers, entrepreneurs and leaders. Postsecondary education can move people up the economic ladder.
Georgia offers a diverse higher education system that serves students of all different backgrounds, ages and family income levels. More low-income, black and Hispanic students are going to college. At the same time, long-term declines in state funding are causing colleges and universities to rely more heavily on tuition, fees and federal sources of money. The great challenge and opportunity for Georgia’s colleges and universities is to support a diverse group of students to graduation and equip them for economic success. The strength of Georgia’s economy depends on it.
Endnotes
[1] 2015 American Community Survey 1-Year Estimates, Table B20004. Median earnings by educational attainment for the population 25 years and over.
[2] 2015 1-Year American Community Survey, Table S2301, Employment Status. Workers ages 25-64. American Community Survey estimates of unemployment tend to be higher than official Current Population Survey estimates. For example, the 2015 ACS unemployment rate was 7.1%, compared to the 2015 CPS rate of 6% (population 16 years and over).
[3] Trostel, P.A. (2007). The fiscal impacts of college attainment. New England Public Policy Center at the Federal Reserve Bank of Boston. Retrieved on April 26, 2017 from https://www.bostonfed.org/-/media/Documents/Workingpapers/PDF/economic/neppc/wp/2007/neppcwp0702.pdf.
[4] Chetty, R., et.al. (2017). Mobility report cards: The role of colleges in intergenerational mobility. Retrieved April 25, 2017 from http://www.equality-of-opportunity.org/papers/coll_mrc_paper.pdf.
[5] Economic Policy Institute analysis of Current Population Survey data, 1979-2016.
[6] Carnevale, A.P., Jayasundera, T., & Gulish, A. (2016) America’s divided recovery: College haves and have-nots. Georgetown University Center on Education and the Workforce. Retrieved April 27, 2017 from https://cew.georgetown.edu/wp-content/uploads/Americas-Divided-Recovery-web.pdf
[7] See note 6.
[8] See note 6. Education levels from GBPI analysis of 2015 American Community Survey microdata, IPUMS-USA, University of Minnesota, www.ipums.org.
[9] GBPI analysis of 2015 American Community Survey microdata, IPUMS-USA, University of Minnesota, www.ipums.org
[10] PolicyLink and the Program for Environmental and Regional Equity at USC. (2016). National Equity Atlas: Georgia. http://nationalequityatlas.org/data-summaries/Georgia/
[11] The University of Georgia Charter, 1785. Retrieved on July 21, 2017 from http://www.libs.uga.edu/hargrett/archives/exhibit/charter/chartertranscription.html
[12] Institutions have a primary classification but may have multiple classifications. For example, Georgia State University is a research university with a secondary function as a state college following its merger with Georgia Perimeter.
[13] University System of Georgia. Semester Enrollment Report, Fall 2016. University System of Georgia. Number of Pell Grant Recipients, Fall 2015. Retrieved on May 18, 2017 from http://www.usg.edu/research/financial_aid. Quarterly Enrollment Report, Resident Enrollment by Institution and County of Origin, All Students, Fall 2016. Retrieved on May 18, 2017 from http://www.usg.edu/research/student_data/semester_enrollment_reports. Rural counties are those classified by Census as mostly or completely rural.
[14] University System of Georgia. Semester Enrollment Report, fall 2016. Includes undergraduate and graduate students
[15] University System of Georgia. Number of Pell Grant Recipients, Fall 2015. Retrieved on May 18, 2017 from http://www.usg.edu/research/financial_aid.
[16] University System of Georgia. Number of Pell Grant Recipients, 2006-2015. Retrieved on May 18, 2017 from http://www.usg.edu/research/financial_aid. Pell Grant recipiency is used as a proxy for low-income students. Although not all low-income students apply and are eligible for the Pell Grant, 72 percent of Pell Grant recipients are from families earning less than $30,000 per year
[17] Technical College System of Georgia. End-of-Year Enrollment Reports, Annual Report 2016, Retrieved on May 16, 2017 from https://kms.tcsg.edu/DPR/ReportsResearch/SystemSum.aspx. Includes enrollment in technical division of Bainbridge State College.
[18] Data on part-time enrollment in Fall 2016 term requested from TCSG. A student is defined as part time for a semester if enrolled in less than 12 credit hours. Received by email June 7, 2017.
[19] See note 18. Colleges are considered to serve predominantly rural populations if the service delivery area has a majority rural population, according to 2010 Census classifications.
[20] See note 18.
[21] Technical College System of Georgia. End-of-Year Enrollment Reports, Annual Reports 1999-2016, Retrieved on May 16, 2017 from https://kms.tcsg.edu/DPR/ReportsResearch/SystemSum.aspx. Includes enrollment in technical division of Bainbridge State College. Between 2011 and 2012, enrollment reporting changed from a quarter- to semester-based academic calendar.
[22] See note 18.
[23] See note 20.
[24] GBPI analysis of FY 2006-2018 budgets.
[25] Georgia’s Fiscal Year 2018 Budget (HB 44).
[26] U.S. Department of Education, National Center for Education Statistics, Integrated Postsecondary Education Data System. GBPI analysis of Georgia public institutions, 2006 and 2015 revenue data.
[27] Georgia’s AFY budgets 2001-2017; FY 2018 Budget (HB44). University System of Georgia, Fall semester enrollment reports 20016-2016.
[28] Georgia’s AFY budgets 2001-2017; FY 2018 Budget (HB44). University System of Georgia, Fall semester enrollment reports 20016-2016.
[29] Georgia’s AFY budgets 2001-2017
[30] U.S. Department of Education, National Center for Education Statistics, Integrated Postsecondary Education Data System. GBPI analysis of Georgia public institutions, 2006 and 2015 revenue data. In 2006, regional universities included Georgia Southern University and the University of West Goergia. By 2015, regional universities were referred to as comprehensive universities and included Kennesaw State University and the University of North Georgia.
[31] GBPI analysis of Fall 2015 University System of Georgia and AY 2016 Technical College System of Georgia data. Received by email in May 2017.
[32] Suggs, C. (2016). Troubling gaps in HOPE point to need-based aid solutions. Georgia Budget and Policy Institute. Retrieved from https://gbpi.org/2016/gaps-in-hope-point-to-need-based-aid/ on March 20, 2017.
[33] Graduation rates by race/ethnicity from University System of Georgia, Graduation Rate Reports, http://www.info.usg.edu/. Graduation rates by income requested from university system. Associate’s degree students who transfer to bachelor’s degree programs are not counted as graduated; including transfers would increase the total rate to 30%.
[34] Data requested from Technical College System of Georgia. Students who enroll in associate’s degree programs and leave after completing some other credential like a certificate are not counted as graduated.
[35] See note 16.
[36] See note 15.
[37] See note 18.