This report offers an assessment of the state of education funding in Georgia by analyzing how it compares to prior years and other states and exploring what areas are due for review or revision. In the FY 2021 budget Georgia returned to a general pattern of cutting education and underfunding specific grants for the state’s neediest schools. Conversely, the state continues healthy investment in the Teachers Retirement System.
Quick Facts
The ![]() ,
, ![]() and
and ![]() symbols indicate change from previous year, which can be found in parentheses.
symbols indicate change from previous year, which can be found in parentheses.
![]() 1,686,318 – Total enrollment in Georgia K-12 public schools in October 2020 (down from 1,719,573)[1]
1,686,318 – Total enrollment in Georgia K-12 public schools in October 2020 (down from 1,719,573)[1]
![]() 6th – Georgia’s national rank in public school enrollment size[2]
6th – Georgia’s national rank in public school enrollment size[2]
![]() No. 35 – Georgia’s national rank in per student funding (down from ranking at No. 34)[3]
No. 35 – Georgia’s national rank in per student funding (down from ranking at No. 34)[3]
![]() $5,313.68 – Amount allocated in QBE formula per full-time student in FY 2021 (down from $5,427)[4]
$5,313.68 – Amount allocated in QBE formula per full-time student in FY 2021 (down from $5,427)[4]
![]() $952,169,870 – Amount cut from state funding in the QBE formula in FY 2021 (QBE was “fully funded” previous year)[5]
$952,169,870 – Amount cut from state funding in the QBE formula in FY 2021 (QBE was “fully funded” previous year)[5]
![]() $1,802 – The gap between the amount of funding per student in Georgia and the national average (a decrease from $1,996, representing an improvement)[6]
$1,802 – The gap between the amount of funding per student in Georgia and the national average (a decrease from $1,996, representing an improvement)[6]
![]() 39.8 percent – Portion of Georgia’s state budget allocated to K-12 public education in FY 2021 (down from 41 percent)
39.8 percent – Portion of Georgia’s state budget allocated to K-12 public education in FY 2021 (down from 41 percent)
![]() $0 – Amount of additional funding Georgia provides for schools specifically to serve students living in poverty, making Georgia one of only eight states that fails to do so
$0 – Amount of additional funding Georgia provides for schools specifically to serve students living in poverty, making Georgia one of only eight states that fails to do so
Failure to Fund Education Adds Up
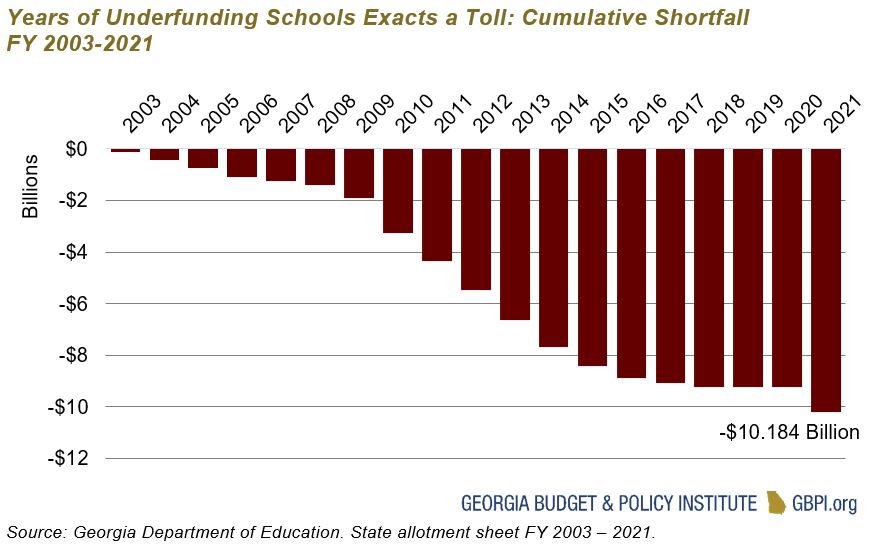
The Georgia General Assembly’s tendency to balance the budget via cuts to public education has resulted in $10.2 billion taken from the state’s children over 19 years. This astounding amount equates to more than $6,000 for every student currently educated in Georgia, the No. 6 largest public school system in the United States. Nearly two decades of strict budget cuts look worse when considering that Georgia’s economy, as measured by gross domestic product (GDP), has grown substantially over this same time period.[7] The state per capita GDP grew 8 percent from 2003 to 2019 while billions were cut from education budgets.[8] This clearly demonstrates a policy choice to underfund K-12 public schools.
Georgia’s inability to raise revenue to pay for essential services leaves the state’s most vulnerable populations again holding the bag. The pandemic has made plain one glaring challenge: the need for high-speed internet in order to deliver an adequate education. Georgia’s Black Belt, a region of the state that is more rural, educates more people of color and has higher concentrations of low-income individuals, does not have the access enjoyed in the rest of the state. Thirteen percent of the households in the Black Belt lack access compared to less than 6 percent throughout the rest of Georgia.[9]
Taking Additional Money from Those That Need It Most
State lawmakers have underfunded many grants—equalization, sparsity and transportation—that schools rely on that sit on top of cuts to the Quality Basic Education funding formula. The equalization grant provides funds for districts that have lower-than-average property wealth and the state offers sparsity grants to schools that cannot provide adequate education programs due to smaller enrollments.
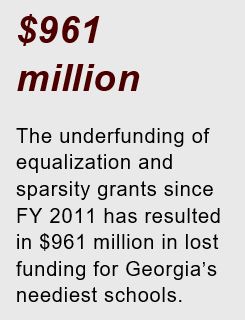 Within the last decade, the Georgia General Assembly has made changes to equalization, from capping funding to limiting the number of districts, which has stymied the ability of low-wealth districts to meet the needs of their students in an equitable way. These changes reduced the grant by hundreds of millions of dollars. Since FY 2014 equalization has been allotted the amount required in the new formula. Sparsity grants have been funded at 25.5 percent of the amount that the formula dictates resulting in $22 million less to sparse, rural districts in FY 2021 alone.[10] The underfunding of equalization and sparsity grants since FY 2011 has resulted in $961 million in lost funding for Georgia’s neediest schools.
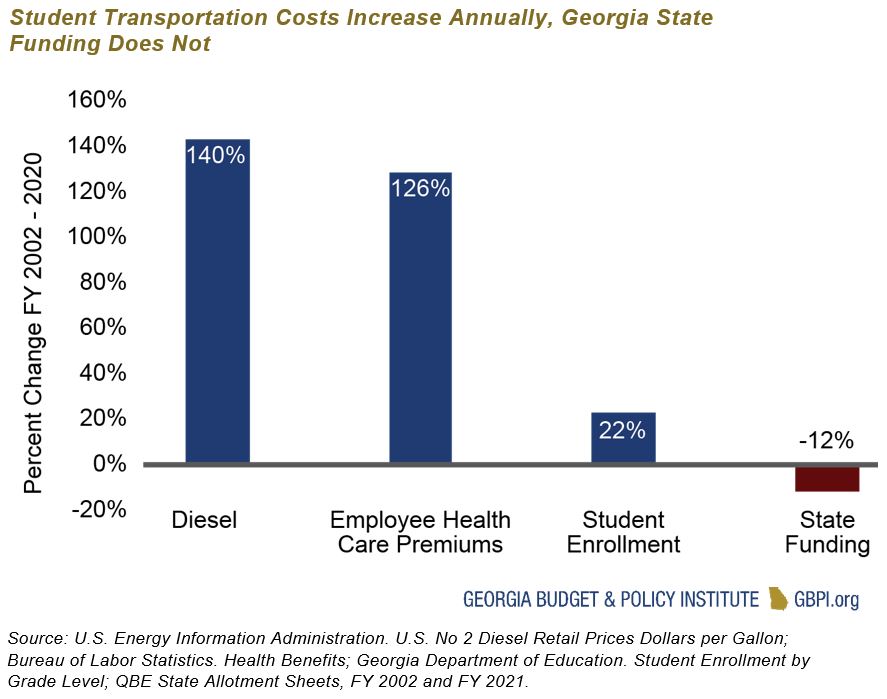
Student transportation across the state has endured similar underfunding. School districts spent $970 million to bus students to and from the schoolhouse in FY 2020. Costs driven by factors such as the price of diesel fuel or the number of students enrolled have increased steadily while state funding has remained flat or decreased during the past two decades. This growth has continued the state trend of reducing its contribution to student transportation funding since 1991 when it covered 54 percent. In FY 2019 the state paid 13 percent of the total cost of pupil transportation.
Withholding billions from public schools looks worse considering that the state annually provides up to $100 million to private school tuition. Since the inception of the Qualified Education Expense Tax Credit in 2008, Georgia has lost out on $735 million to tax shelters that are instructed to pay for private school vouchers. Adequate public, not private, schools are a requirement of the state constitution.
Georgia Continues to Invest Strongly in Teachers Retirement System
There is one significant area of education spending where Georgia continues to invest without interruption: the Teachers Retirement System of Georgia (TRS). State lawmakers have consistently paid the actuarially-determined employer contribution (the amount experts suggest is needed in order to cover costs), even as that amount steadily increased from FY 2006 to FY 2019.[11] However, the determined state contributions plateau for FY 2020 through FY 2022.[12] This defined benefit plan is regularly cited as a recruitment and retention tool and, when the amount of the benefit and financial position is taken into account, a boon to this state’s public education system.[13]
Policy Implications
The last two decades in Georgia have seen great economic expansion and retraction. One constant is an erosion of nearly every facet of public school funding support from the state. Due to the uniquely American policy of balancing school budgets on state and local funding, schools are left relying more heavily on local property taxes to fill budget holes. While many districts might be able to weather a short recession through reserves and strategic cuts, there are several school systems that do not have the luxury and will discount children’s educational opportunities as a result.[14]
However, lawmakers’ dedication to funding the Teachers Retirement System is laudable and puts Georgia in a healthy position nationally in regard to pensions. In order to shore up this state’s public schools’ foundation, policymakers ought to treat the entire system with the same commitment.
Endnotes
[1] Georgia Department of Education. Student enrollment by grade level (PK-12). https://oraapp.doe.k12.ga.us/ows-bin/owa/fte_pack_enrollgrade.entry_form
[2] National Center for Education Statistics. (2018). Enrollment in public elementary and secondary schools, by region, state, and jurisdiction: Selected years, fall 1990 through fall 2029. https://nces.ed.gov/programs/digest/d19/tables/dt19_203.20.asp?current=yes
[3] U.S. Census Bureau. (2018). Annual survey of school system finances. https://www.census.gov/programs-surveys/school-finances.html
[4] Based on a GBPI analysis of Georgia Department of Education Allotment Sheets. Earnings sheet for FY 2021. https://financeweb.doe.k12.ga.us/QBEPublicWeb/ReportsMenu.aspx
[5] Georgia Department of Education. Earnings Sheet for FY 2021. https://financeweb.doe.k12.ga.us/QBEPublicWeb/ReportsMenu.aspx
[6] Ibid.
[7] Bureau of Economic Analysis. (2020). Gross domestic product (GDP) by state: All industry total (Index).
[8] Ibid.
[9] Georgia Department of Community Affairs. (n.d.) Phase 1 unserved Georgia by county.
https://broadband.georgia.gov/maps/gbdi-unserved-county; “County statistics are based on a fixed, terrestrial broadband definition of 25 Mbps down and 3 Mbps up, and where the broadband service is available to at least ONE consumer (residential and business) in a census block; broadband data is based on June 2017 Federal Communications Commission (FCC) form 477 data.”
[10] Data provided to GBPI by the Georgia Department of Education.
[11] Brainard, K. & Brown, A. The Annual Required Contribution Experience of State Retirement Plans, FY 01 to FY 13. National Association of State Retirement Administrators. https://www.nasra.org/files/JointPublications/NASRA_ARC_Spotlight.pdf
[12] Teachers Retirement System of Georgia. Contribution Rates. https://www.trsga.com/employer/contribution-rates/
[13] Owens, S. (2019). Teachers Retirement System of Georgia explained. Georgia Budget and Policy Institute. https://gbpi.org/teachers-retirement-system-of-georgia-explained/
[14] Owens, S. (2020). Difficult choices made worse by budget cuts: Results from GBPI’s 2020 school district survey. Georgia Budget and Policy Institute. https://gbpi.org/difficult-choices-made-worse-by-budget-cuts-2020-school-district-survey/