
The United States is experiencing income inequality at a level not seen since the 1920s, and it is worse in Atlanta than in any other major American city.[1] The consequences of this inequality are made clear when examining student performance across districts. Georgia has one of the highest overall rates of child poverty in the nation and simultaneously provides schools with no specific funding to support these children—one of only six such states.[2] This year’s edition of the State of Education Funding report will focus exclusively on poverty in Georgia’s schools and what can be done to support schools serving learners experiencing poverty. Georgia must join the rest of the nation and create an Opportunity Weight in the school funding formula to specifically address the needs of students living in poverty. This type of funding would help ensure these students are given comparable opportunities to their wealthier peers.
Understanding Poverty in Georgia’s Schools
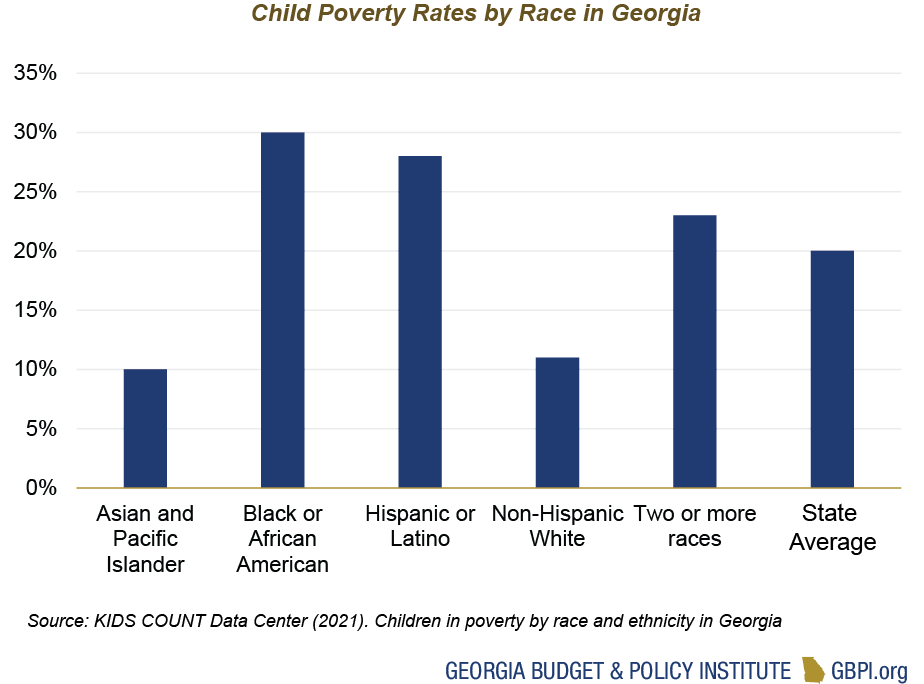
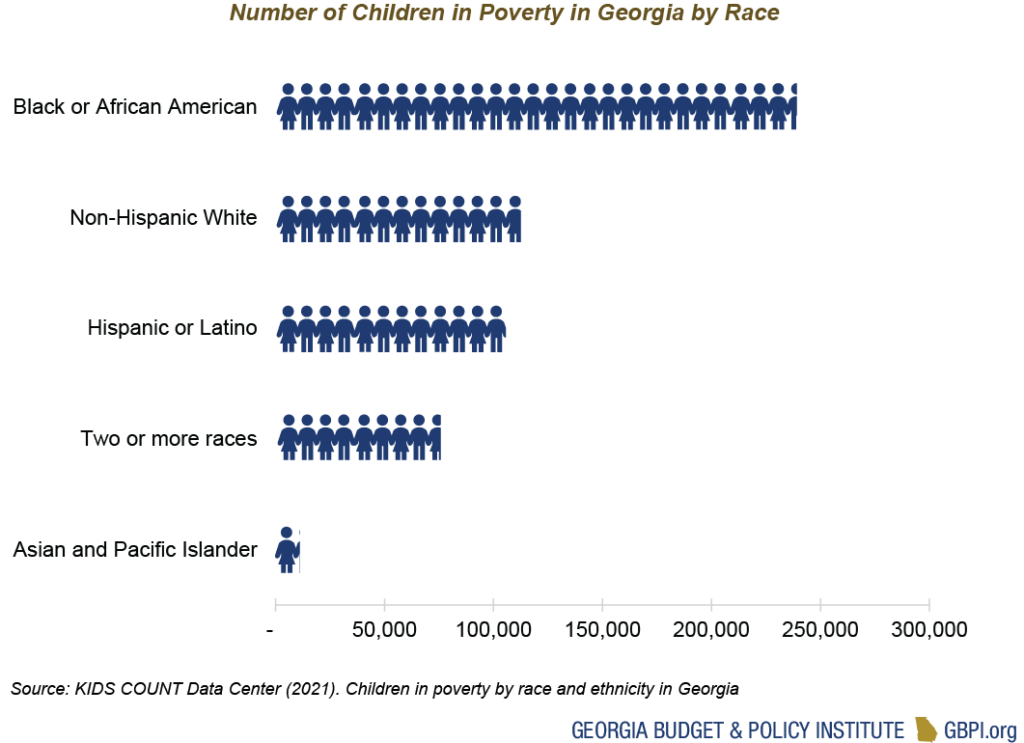
As of 2020, Georgia had more children (aged 0-17) in poverty than 43 other states.[3] According to the most recent Georgia KIDS COUNT Data, 20 percent of children in Georgia live in families with incomes below the federal poverty level.[4] Black and Brown children are much more likely to live in poverty than their white and Asian American or Pacific Islander (AAPI) neighbors. The graphs below show the breakdown by race.
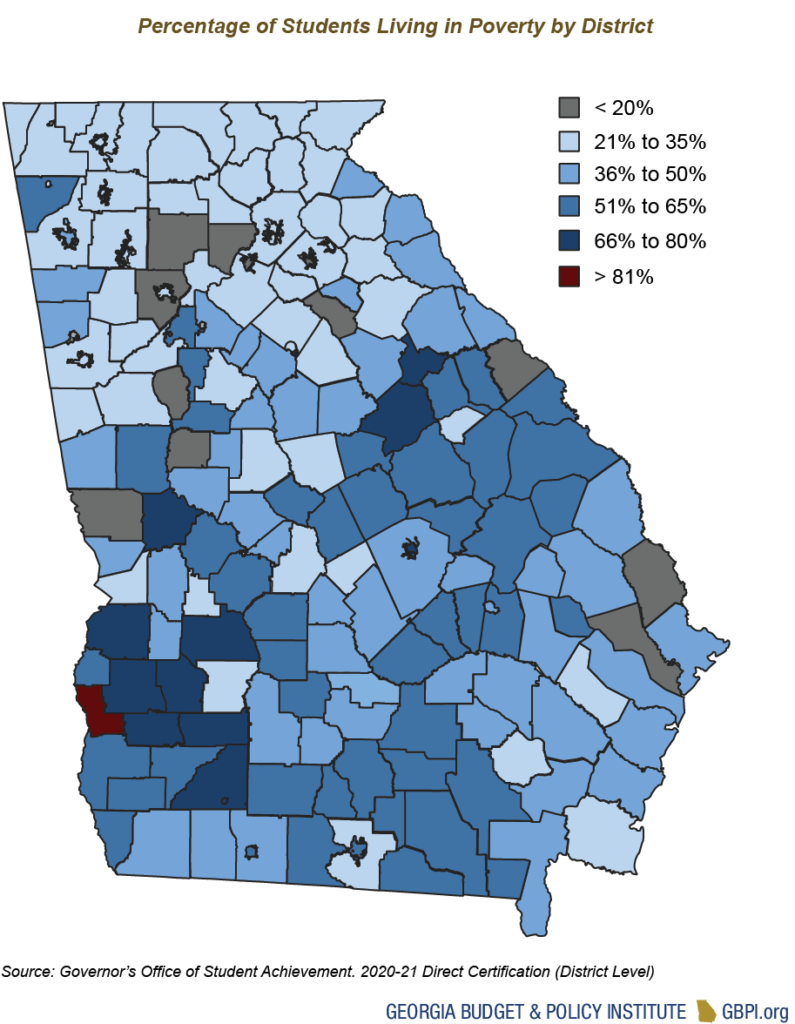
The map below shows the distribution of students in poverty by school district.
This racial disparity seen above is neither unique to Georgia nor inevitable. Twenty-eight percent of Hispanic or Latinx children live in poverty. These children are more likely to have immigrant parents, a group of Georgians who tend to have the lowest income levels. Immigrant workers are clustered in jobs with lower pay, fewer benefits and scant worker protections.[5] Black families, on average, have one-eighth the household wealth of typical white families.[6] The cumulative effect of slavery; Jim Crow legislation; school and housing segregation; explicit and implicit bias, and more created and cemented the persistent poverty in Black communities in the U.S. Even once racist policies are removed, wealth can be determined well before a child enters the workforce. The Board of Governors of the Federal Reserve showed that inheritances and other family support are the largest contributors to the differences in racial wealth in America.[7]
The impact of a family’s resources can be easily seen in educational outcomes. The graphs below show the performance on two Georgia Milestones standardized tests, broken down by income. Students are graded on a scale from Beginning (the lowest) to Proficient.
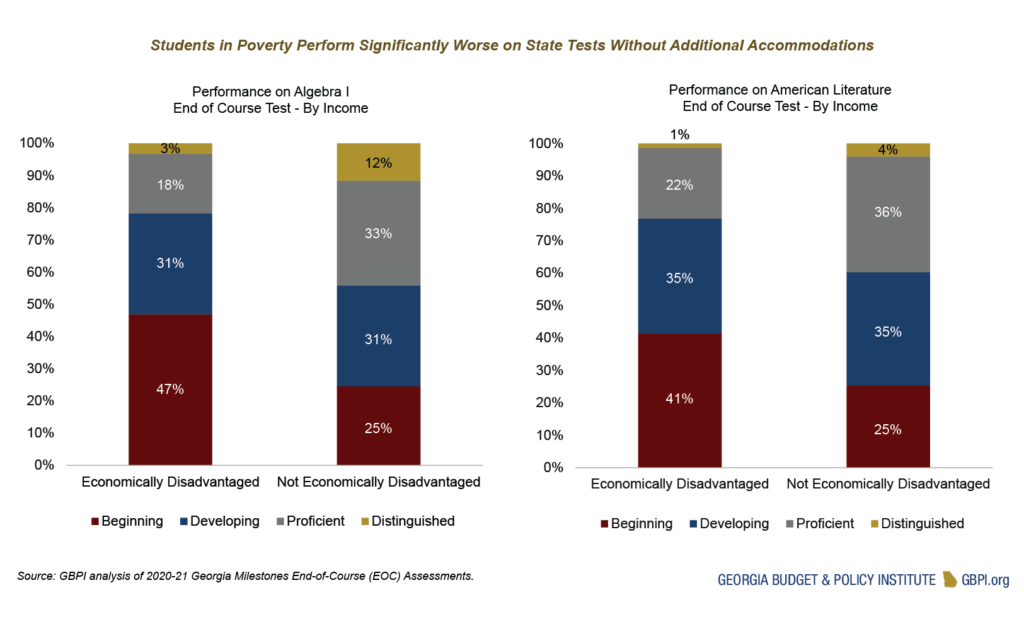
This difference in test score performance is often called an “achievement gap,” but that language gives the impression that it is accidental. Much of a child’s school performance is tied to factors outside the school (housing stability, food security, mental health supports, etc.) that may negatively impact student achievement if those challenges go unaddressed. Therefore, it is less of an achievement gap and more like a wealth grade curve.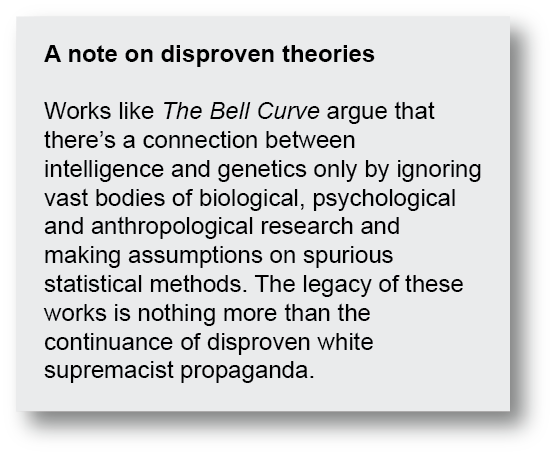
Often statistics like those above can lead people to racist or classist conclusions. There is no connection between race/income and intelligence. The Georgia Department of Education has a measure of student growth, Student Growth Percentiles (SGPs), which better evaluates how much a child has improved throughout the school year than measuring whether a student “passes” a state test. Based on SGPs results, there exists no relationship between the percentage of students living in poverty and whether those students exhibit “typical” or “high” growth. Put simply, any difference in test scores between students in poverty and the rest of the state is a consequence of resources and opportunities, not intelligence.
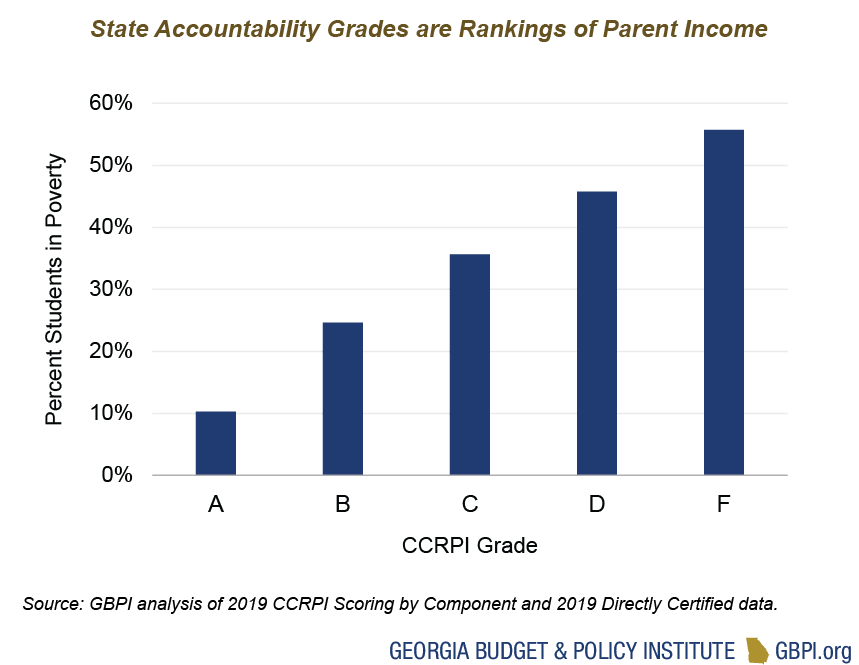
Regardless of this fact, parents, community members and policymakers are often presented with the wealth grading curve as if it is an objective measure of quality. Georgia’s accountability grading system, the College and Career Readiness Performance Index (CCRPI), gives each school and district a rating from 1-100. CCRPI, due to federal and state laws, relies on standardized test scores. The following graph analyzes every school’s CCRPI grade next to the percentage of students living in poverty. Schools that score an “A” average 10.3 percent of the student population living in poverty, compared to 56 percent of the student body for schools that received an “F.”
The wealth grading curve is steeper in Georgia than in most states. The National Assessment of Educational Progress (NAEP) is considered the gold standard of state test comparisons. While students living in poverty score worse on NAEP than their higher-income classmates in all states, the distance is greater in Georgia. Using average 4th-grade scale scores for the last 20 years, Georgia is 31st in the nation in reading and 41st in mathematics. In fact, the wealth grading curve in mathematics is steeper in Georgia than in any other southern state.
![]()
Eighth grade reading and mathematics show a similar pattern—Georgia averages 36th in mathematics and 34th in reading. These results can be partly explained by the reality that Georgia remains one of only six states that refuses to provide schools with the additional funding needed to educate students living in poverty. Over the last two decades, it has become clear that Georgia’s students who live in poverty are being pushed further behind their wealthier classmates compared to students in other states.
The Case for Additional State Spending in Education
The problems outlined above can be addressed through state investment in schools, and it makes fiscal sense to do so. Every dollar spent on ensuring all students have equally high levels of performance regardless of race, ethnicity, zip code or economic status saves an estimated $2.60. According to a RAND Corporation study, these savings can be attributed to increased tax revenues and decreased spending on social programs.[8] The Center for American Progress also found that significant public commitment to school funding is repaid in future economic growth.[9]
A recent study in the Journal of Labor Economics found that state school finance reforms that brought spending in low-income communities more in line with those in high-income communities had a large effect on the intergenerational mobility of students in poverty. This move toward more equitable budgeting increased the likelihood that these students would earn higher wages over their lifetime than their parents.[10] One analysis reviewed school finance reforms of the 1970s and 1980s and discovered that “the estimated effect of a 21.7% increase in per-pupil spending throughout all 12 school-age years for children from low-income families is large enough to eliminate the education attainment gap between children from low-income and non-poor families.”[11]
Policy Recommendation: Create an Opportunity Weight in Georgia School Funding Formula
The combination of high child poverty rates and limited resources to support these students puts Georgia schools in an impossible position. If we expect these schools to produce an educated populace but only resource them to do so for a fraction of the state’s children, then we are further cementing inequality.
Most of Georgia’s school funding is determined by a system of weights where children with different needs are weighted differently to earn their school funding. A 9th through 12th-grade general education student is given a weight of 1, while a child in special education would “earn” a much higher weight, for example, since the latter student would need smaller class sizes and other accommodations. This type of funding is structural equity: different needs demand different resources. An Opportunity Weight, or a weight in the formula provided to educate students living in poverty, would modernize the way we fund schools in Georgia to recognize the immense challenge of inequity and be a tool for racial justice. If Georgia policymakers directed resources to help educate students in poverty, it would flow to every community in the state and equitably to Black and Brown learners. A policy like this is overdue for these students. Specifically, it is beyond time for all children to be granted the same opportunity.
Endnotes
[1] Stone, C., Trisi, D., Sherman, A., & Debot, B. (2015). A guide to statistics on historical trends in income inequality. Center on Budget and Policy Priorities. https://www.cbpp.org/research/poverty-and-inequality/a-guide-to-statistics-on-historical-trends-in-income-inequality; Jackson, D. (2022, November 28). Atlanta has the highest income inequality in the nation, Census data shows. Atlanta Journal-Constitution. https://www.ajc.com/news/investigations/atlanta-has-the-highest-income-inequality-in-the-nation-census-data-shows/YJRZ6A4UGBFWTMYICTG2BCOUPU/
[2] Education Commission of the States. (2021). Funding for students from low-income backgrounds. https://reports.ecs.org/comparisons/k-12-and-special-education-funding-06
[3] U.S. Department of Agriculture. (2020). https://data.ers.usda.gov/reports.aspx?ID=17826#Pdeeb6664109a436caf670b19a2951669_3_241iT3
[4] Annie E. Casey Foundation. (2022). KIDS COUNT Data Center. https://datacenter.kidscount.org/data/tables/44-children-in-poverty-by-race-and-ethnicity?loc=12&loct=2#detailed/2/12/false/2048,1729,37,871,870,573,869,36,868,867/10,11,9,12,1,185,13/324,323
[5] Foxen, P., & Mather, M. (2016). Toward a more equitable future: the trends and challenges facing America’s Latino children. National Council of La Raza. https://eric.ed.gov/?id=ED571647
[6] Bhutta, N., Chang, A.C. Dettling, L.J., & Hsu, J.W. (2020). Disparities in wealth by race and ethnicity in the 2019 Survey of Consumer Finances. Board of Governors of the Federal Reserve System. https://www.federalreserve.gov/econres/notes/feds-notes/disparities-in-wealth-by-race-and-ethnicity-in-the-2019-survey-of-consumer-finances-20200928.html
[7] Ibid.
[8] Vernez, G., Krop, R. A., & Rydell, C. P. (1999). Closing the education gap: Benefits and costs. RAND. https://www.rand.org/pubs/monograph_reports/MR1036.html
[9] Lynch, R. G., & Oakford, P. (2014). The economic benefits of closing educational achievement gaps: Promoting growth and strengthening the nation by improving the educational outcomes of children of color. Center for American Progress. https://www.americanprogress.org/article/the-economic-benefits-of-closing-educational-achievement-gaps/#:~:text=If%20the%20United%20States%20were,%242.3%20trillion%E2%80%94larger%20in%202050.
[10] Baisi, B. (2022). School finance equalization increases intergenerational mobility. Journal of Labor Economics, 41(1). https://doi.org/10.1086/718980
[11] Jackson, C. K., Johnson, R. C., & Persico, C. (2015). The effects of school spending on educational and economic outcomes: Evidence from school finance reforms. National Bureau of Economic Research. https://www.nber.org/system/files/working_papers/w20847/w20847.pdf