Postsecondary education and training are key to long-term financial security, as more Georgia employers want to hire workers with college credentials. While higher education is growing more essential for jobs of the future, the price students and families pay is rising. That makes a college investment more burdensome and riskier than in the past.
Rising tuition and fees are linked to several factors, but the decline in public funding for higher education plays a major role. State funding helps keep tuition and fees lower at public colleges and universities. State funding for scholarship and grant programs further reduces the cost of attendance. So, when state lawmakers cut scholarship amounts in recent years, Georgia’s students and families got stuck with a bigger bill.
The consequences of decreased state funding, weakened scholarships and skyrocketing costs for students and families played out in Georgia over the past decade. State lawmakers cut higher education budgets during the recession that started in 2007, prompting institutions to raise tuition and fees to offset the difference.
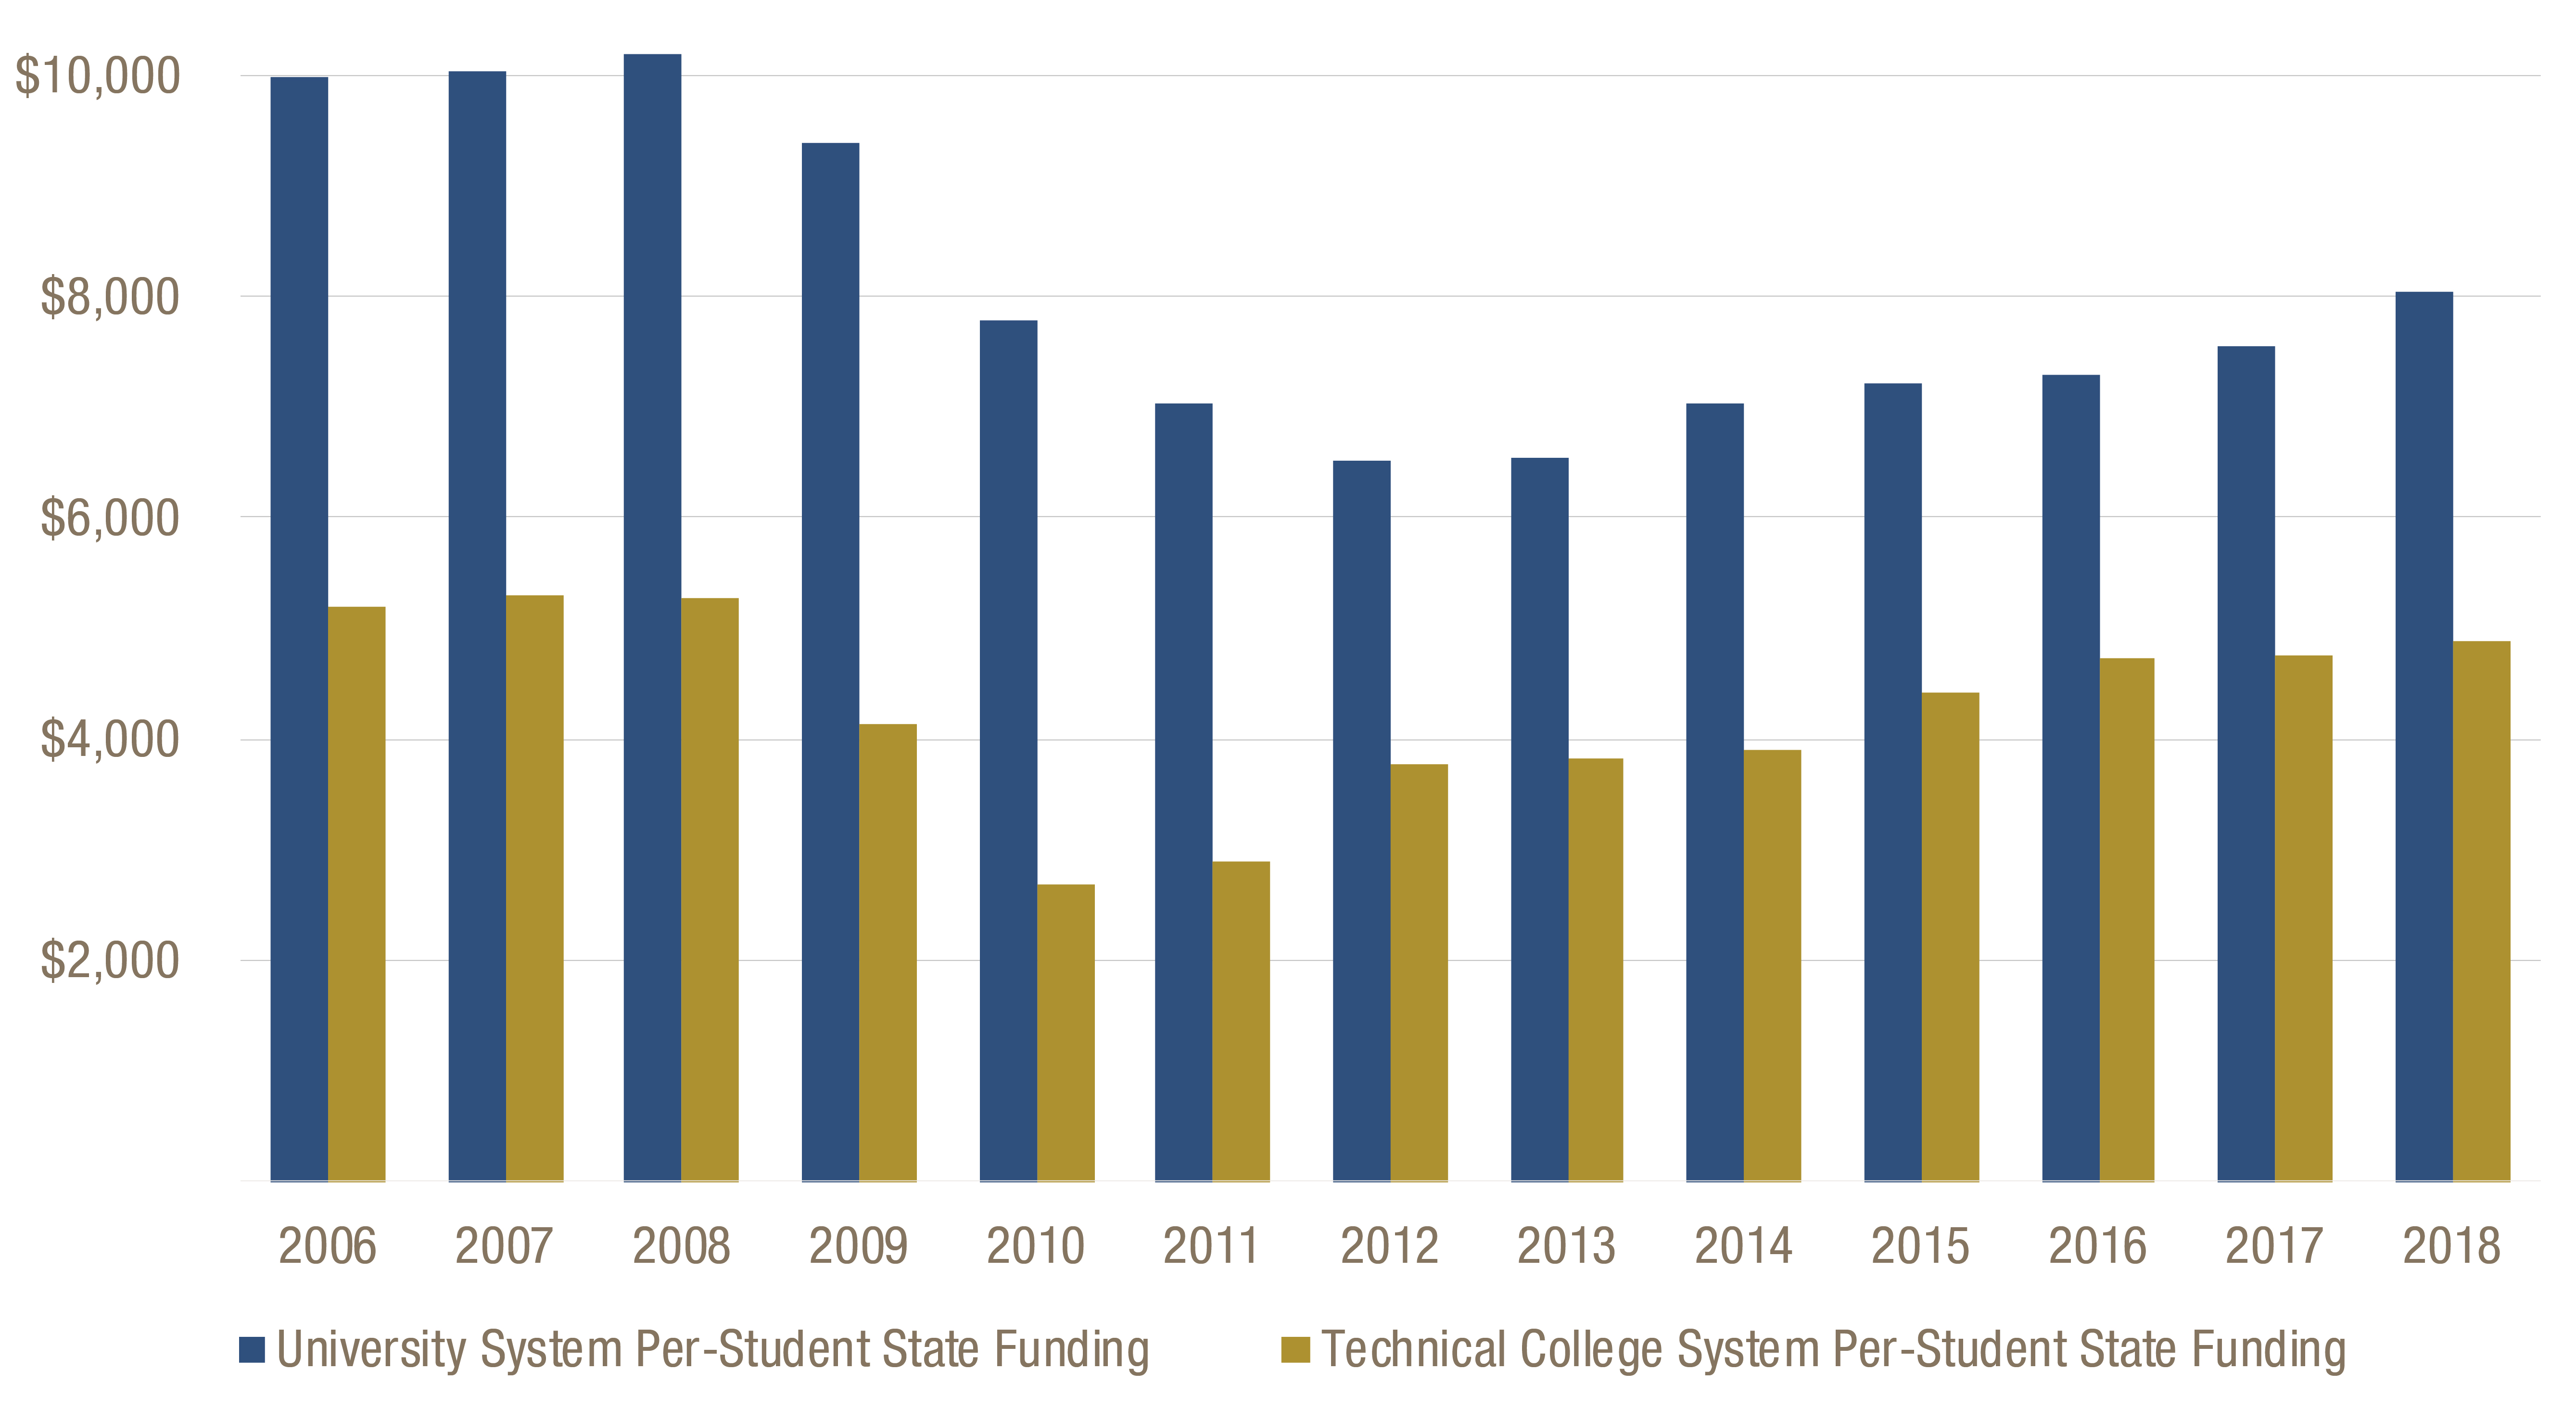
Per-student state funding fell 36 percent from 2008 to 2012 in the university system and 45 percent from 2008 to 2011 in technical colleges. A 40 percent tuition increase across both systems occurred at the same time. When the Legislature cut the HOPE program in 2011, the net price for students spiked by 19 percent.[1] All these factors combined with the recession’s drag on family finances pushed students to turn to loans. Half of Georgia’s university undergraduates carried student loans in 2016, up from about one third in 2007.
Higher prices create added challenges for students trying to graduate. Funding cuts reduce the capacity of schools to build support systems for students. Georgia is enrolling more students with financial need. Rising costs hurt low-income students the most, even as they probably stand to gain the most from postsecondary education. Many students begin college with high hopes but do not complete a degree program. Low-income students face higher barriers to graduation than their peers, which is a worrisome trend since this group is nearly half of Georgia’s college students
The following recommendations are aimed to help guide state lawmakers in coming months as they work to strengthen Georgia’s colleges and universities and offer students and families a more affordable path to a degree:
- Work to return higher educating funding back to historical levels
- Designate a portion of the state treasury’s Revenue Shortfall Reserve as a pool to protect students against large tuition increases during widespread state budget cuts
- Develop a state aid program targeted to increased levels of family financial need
State Funding for Higher Education Is in Long-Term Decline
State funding was long the largest source of money for Georgia’s public colleges and universities. But state funding has been in a long slide.[2] The state once paid 75 percent of public higher education costs, but that now sits at 50 percent.[3] When the current higher education funding formula was developed in 1982 by the Study Committee on Public Higher Education Finance, tuition and fees totaled 19 percent of overall revenues. The committee recommended tuition and fees increase to reach 25 percent.[4]
Economic recessions create acute challenges for higher education institutions. State budget cuts lead to a financial squeeze just as enrollment increases due to students pursuing education and training in response to a weakened job market.
Recession Led to Big Higher Education Funding Cuts
During Georgia’s recession-era budget cuts, schools used a variety of strategies to pare spending. Colleges and universities froze faculty and staff hiring, used more part-time faculty, cut travel budgets, delayed the replacement of aging supplies and technology, reduced library hours and other student support services, instituted furlough days and shifted more health insurance costs to employees. To make up some of the revenue shortfall, colleges raised tuition and fees and instituted a new Special Institutional Fee, which remains in place.
Does State Spending Affect College Completion?The governor’s Complete College Georgia initiative keeps policymakers focused on raising the bar for postsecondary education attainment. Colleges and universities need to improve college completion rates to meet the initiative’s goals and also close the disparities among schools and by students’ income, race and ethnicity. State funding for colleges and universities can help support investment in strategies to boost graduation. Nationwide, less selective public colleges with fewer resources and lower completion rates increase graduation rates with added state funding, according to recent research. Increased state funding is even more effective at boosting graduation rates in these colleges than reducing prices for students. Improved completion rates could be attributable to increased investment in student support, including advising, tutoring and mentoring.[5] |
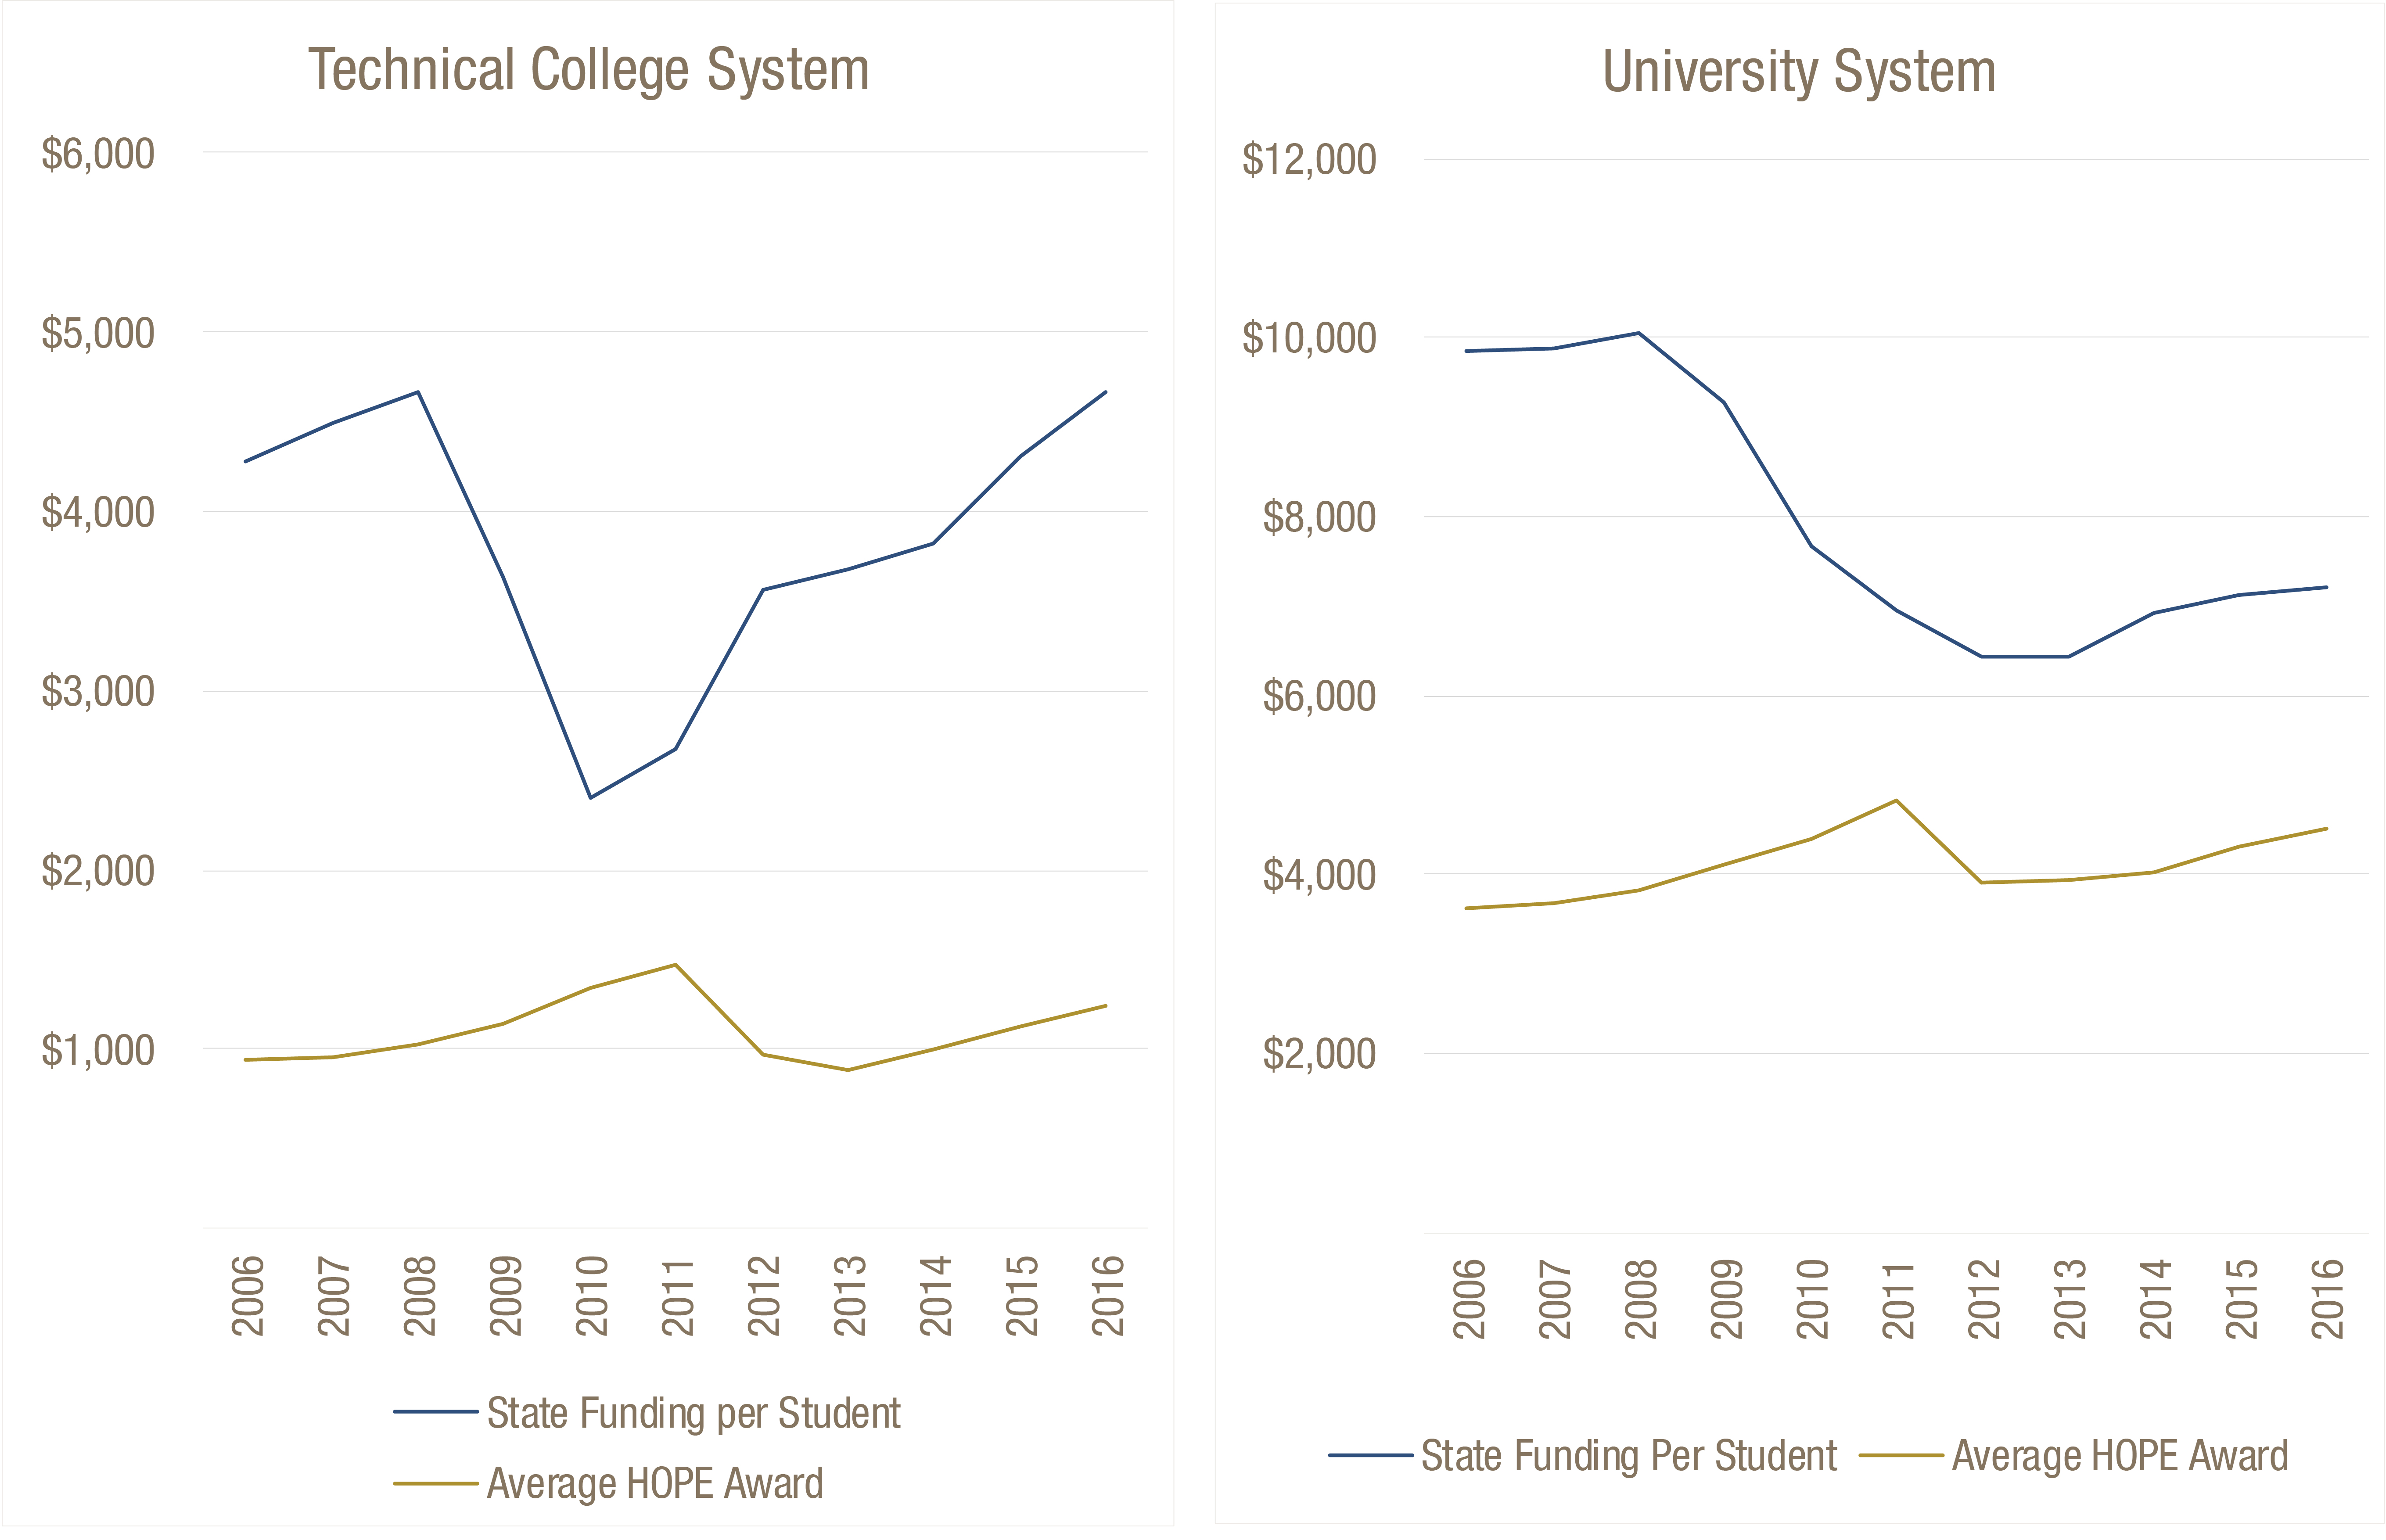
State budget cuts and subsequent tuition and fee increases led to increased spending for HOPE scholarships and grants.[6] The Legislature responded to rising spending with a cut to the award amounts for most HOPE scholarships and grants beginning in 2011.
Spike in HOPE Spending Followed Cuts to University and Technical College System Budgets
Cuts to State Budget, HOPE Push More Costs to Students and Parents
As colleges and universities relied more on tuition and fee revenue the past decade, average tuition and fees rose at all institutions. The largest increases coincided with the biggest drops in per-student state funding.[7] Per-student state funding fell 36 percent from 2008 to 2012 in the university system and 45 percent from 2008 to 2011 in technical colleges. At the same time, tuition increased 40 percent across both systems.
Colleges Raised Tuition, Fees in Response to Budget Cuts

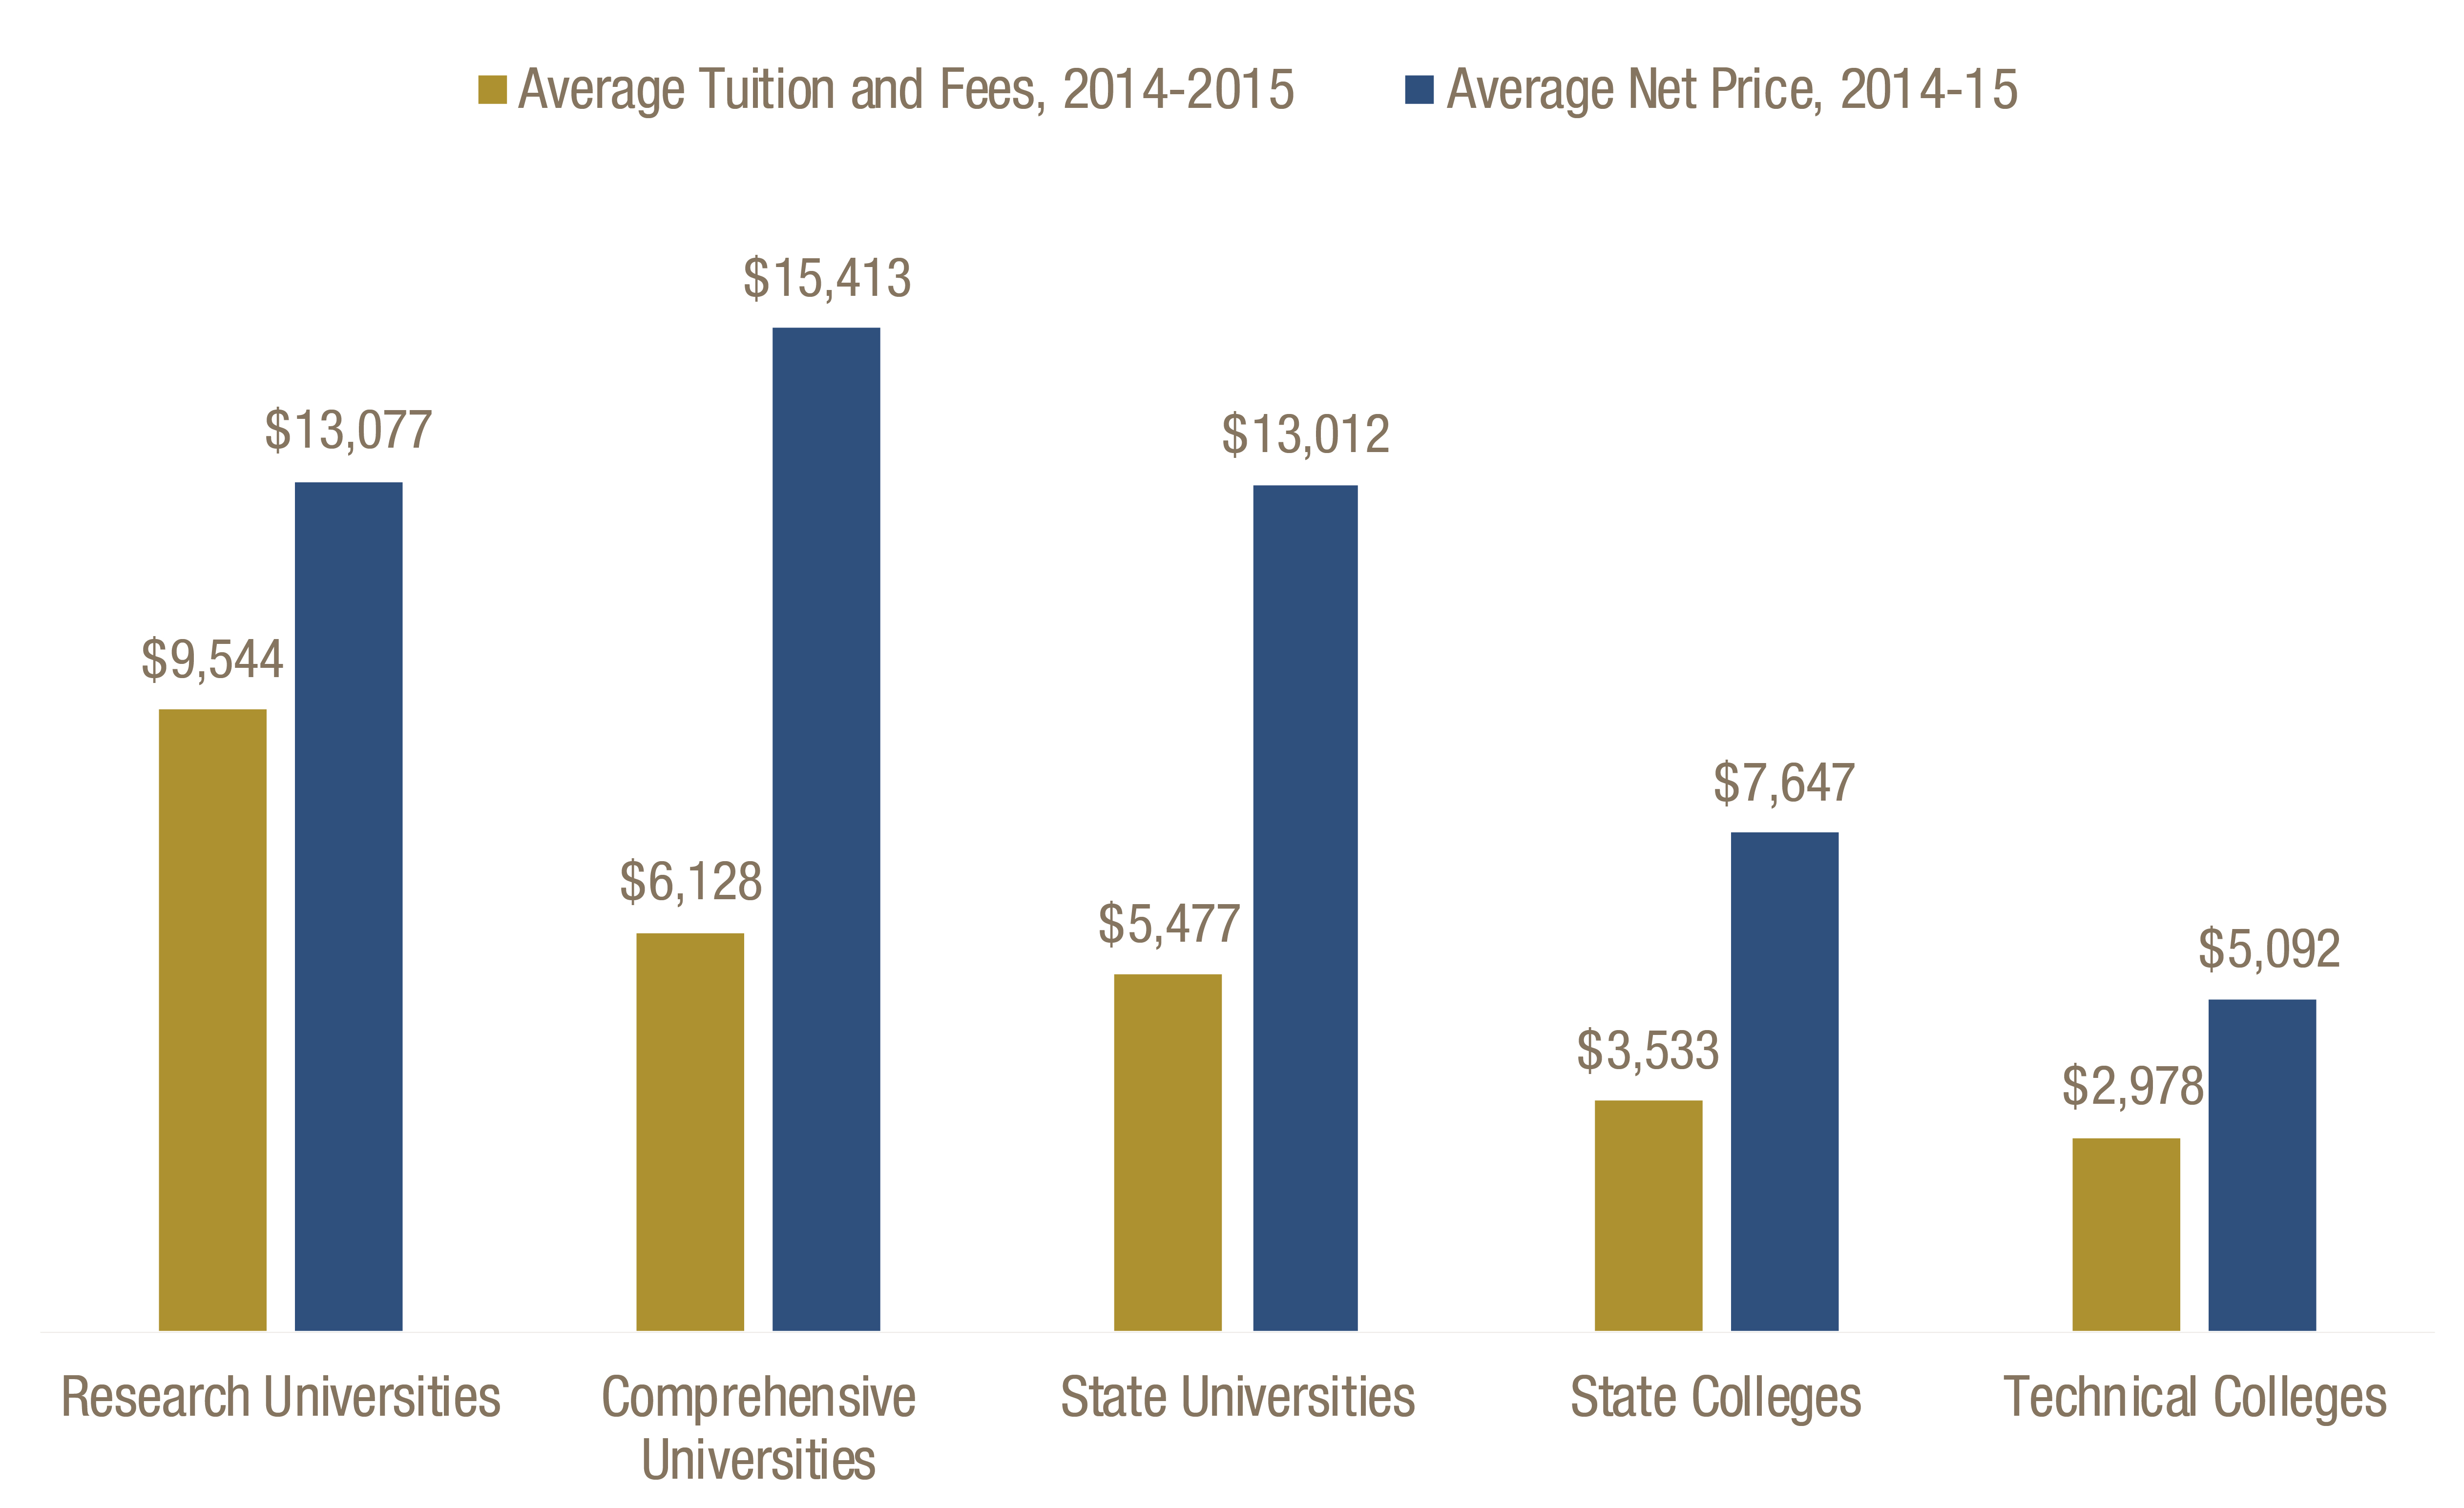
Tuition and fees are a sizable cost for many students. Still, they are often less than half the full cost of attendance, which includes books, housing and food. To lower the full cost, students pursue grants and scholarships. The net price accounts for this financial aid.
Tuition and fees rose during budget cuts, while the average net price did not. This is perhaps due to more students receiving financial aid such as the need-based Pell Grant, and the HOPE scholarships and grants, which still covered full tuition and fees during the largest budget cuts.
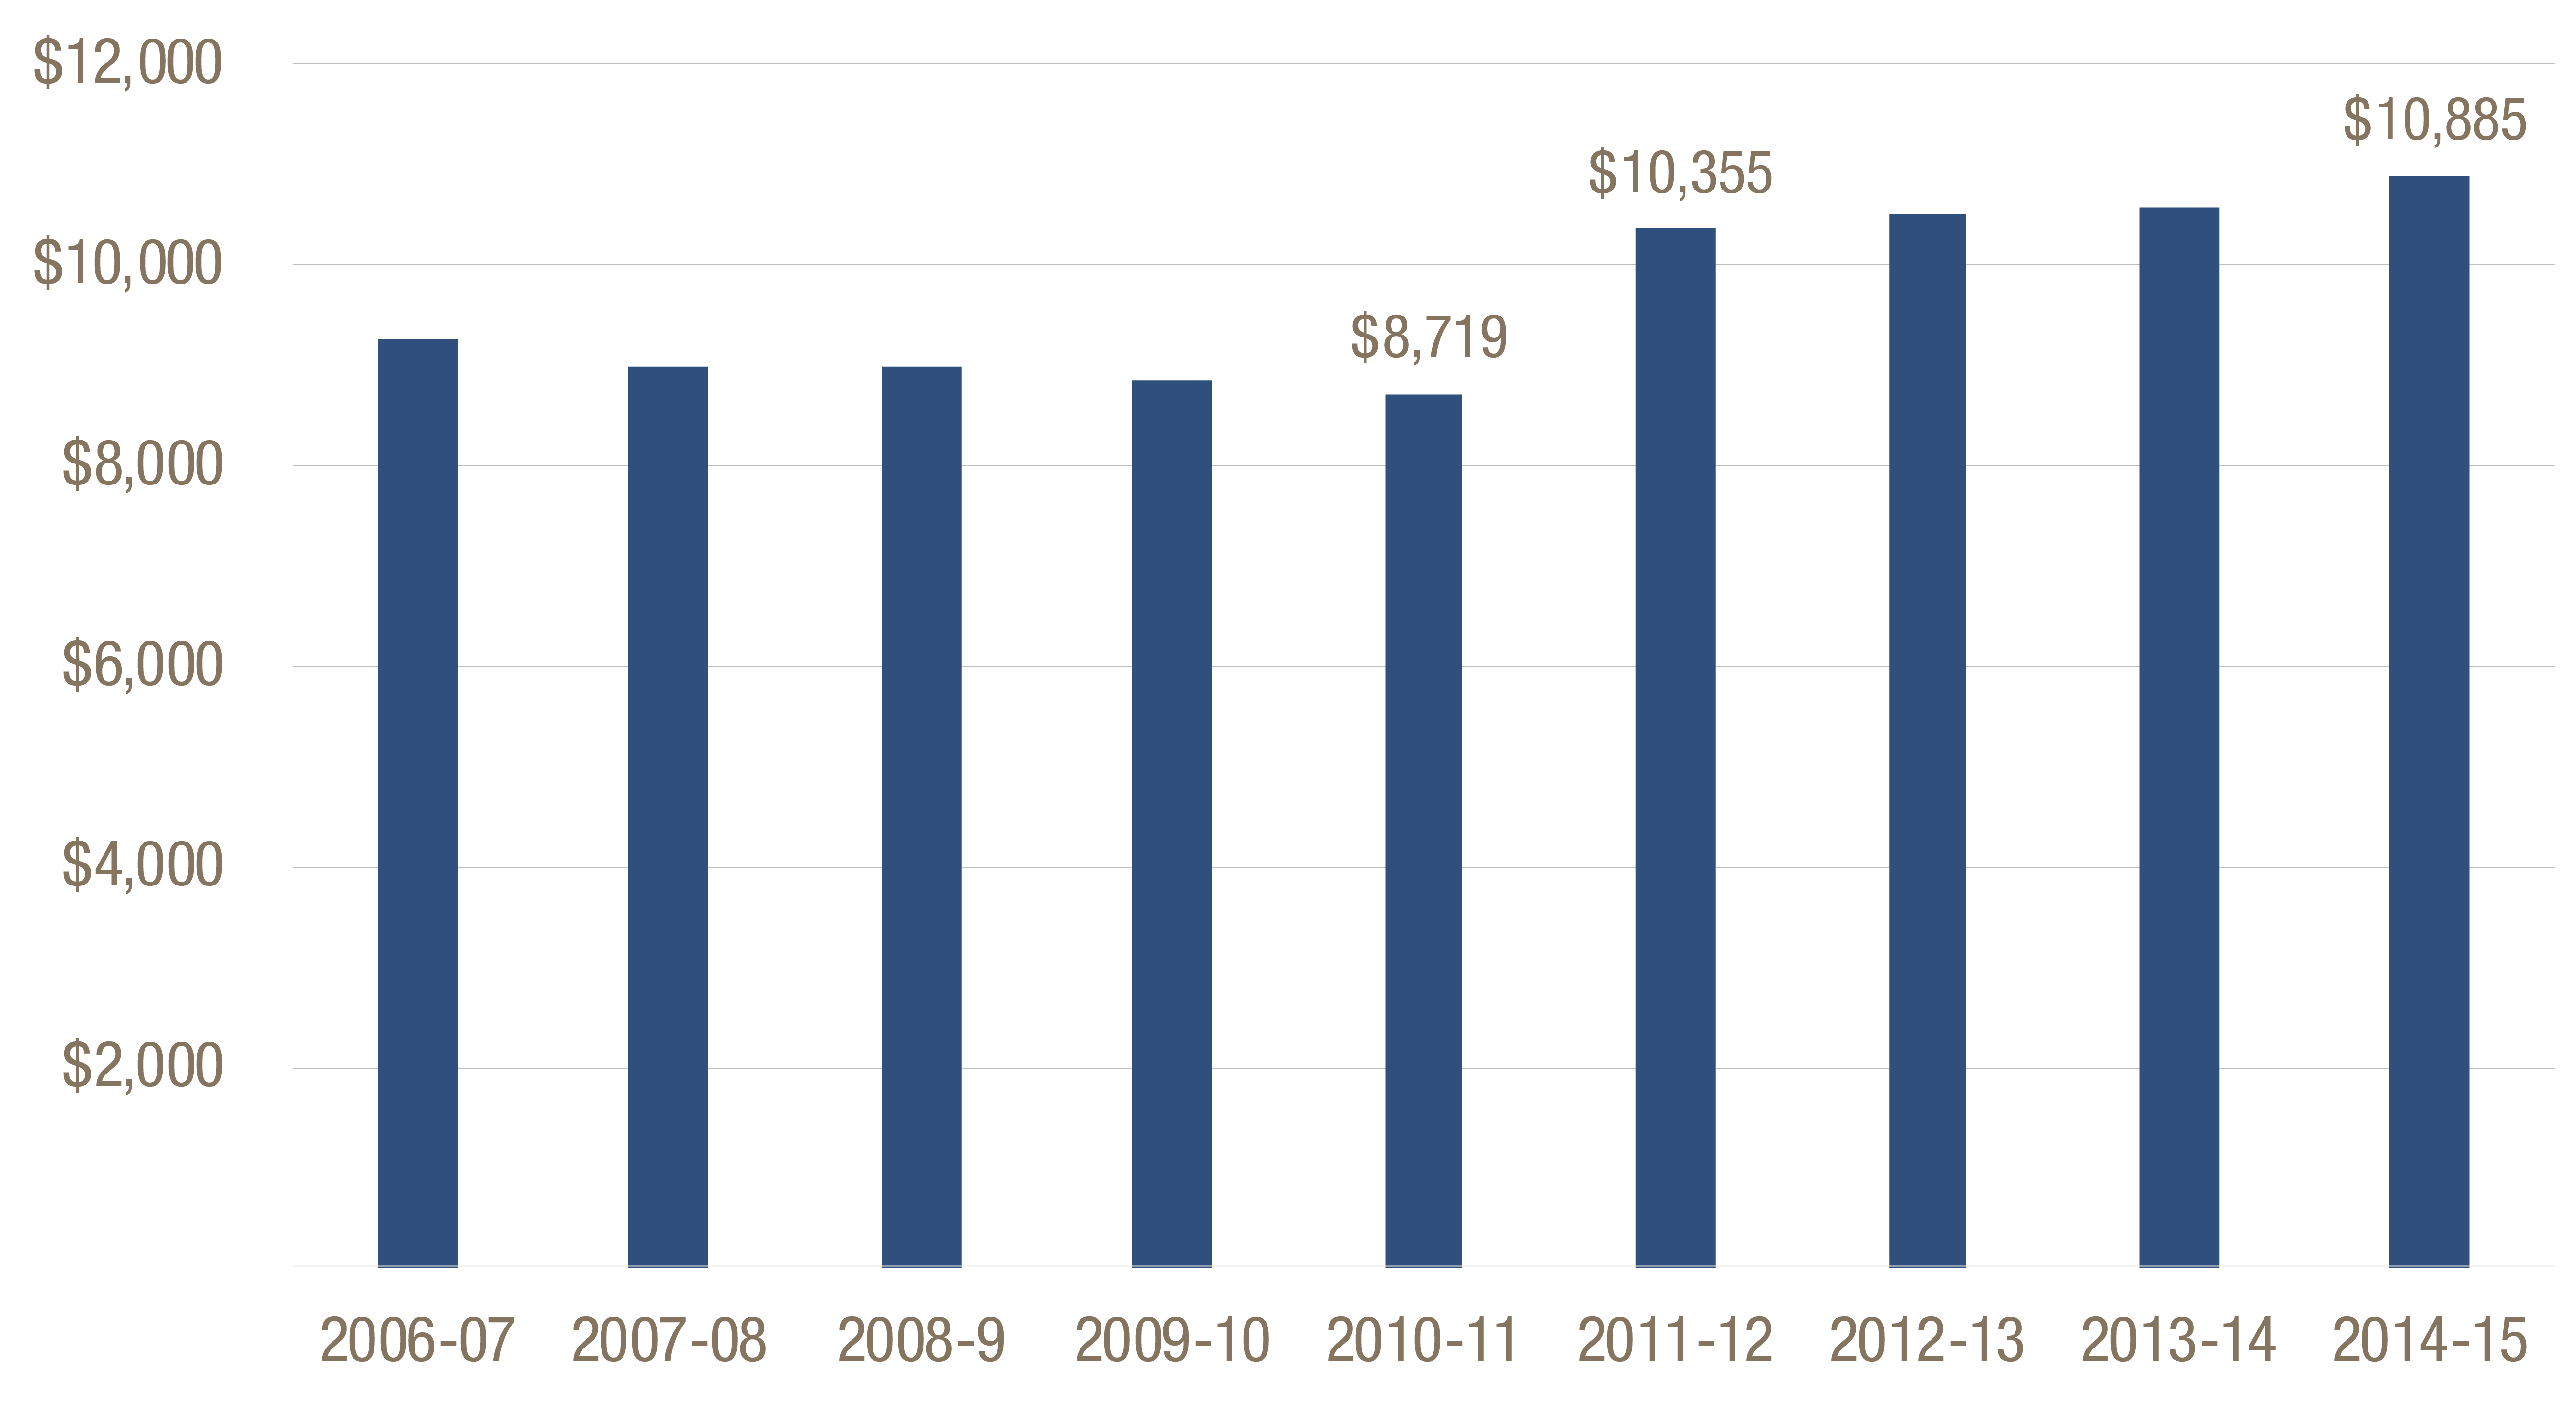
After cuts to the HOPE programs in 2011, average net price across the university system increased by 19 percent.[8] In the technical college system, where tuition and fees make up a much smaller share of the total cost of attendance, average net price did not increase. However, student enrollment in technical colleges dropped. Pell enrollment decreased by 9 percent, while non-Pell enrollment dropped by 33 percent.[9]
Average Net Price in University System Increased By 19 Percent After 2011 Cuts to HOPE
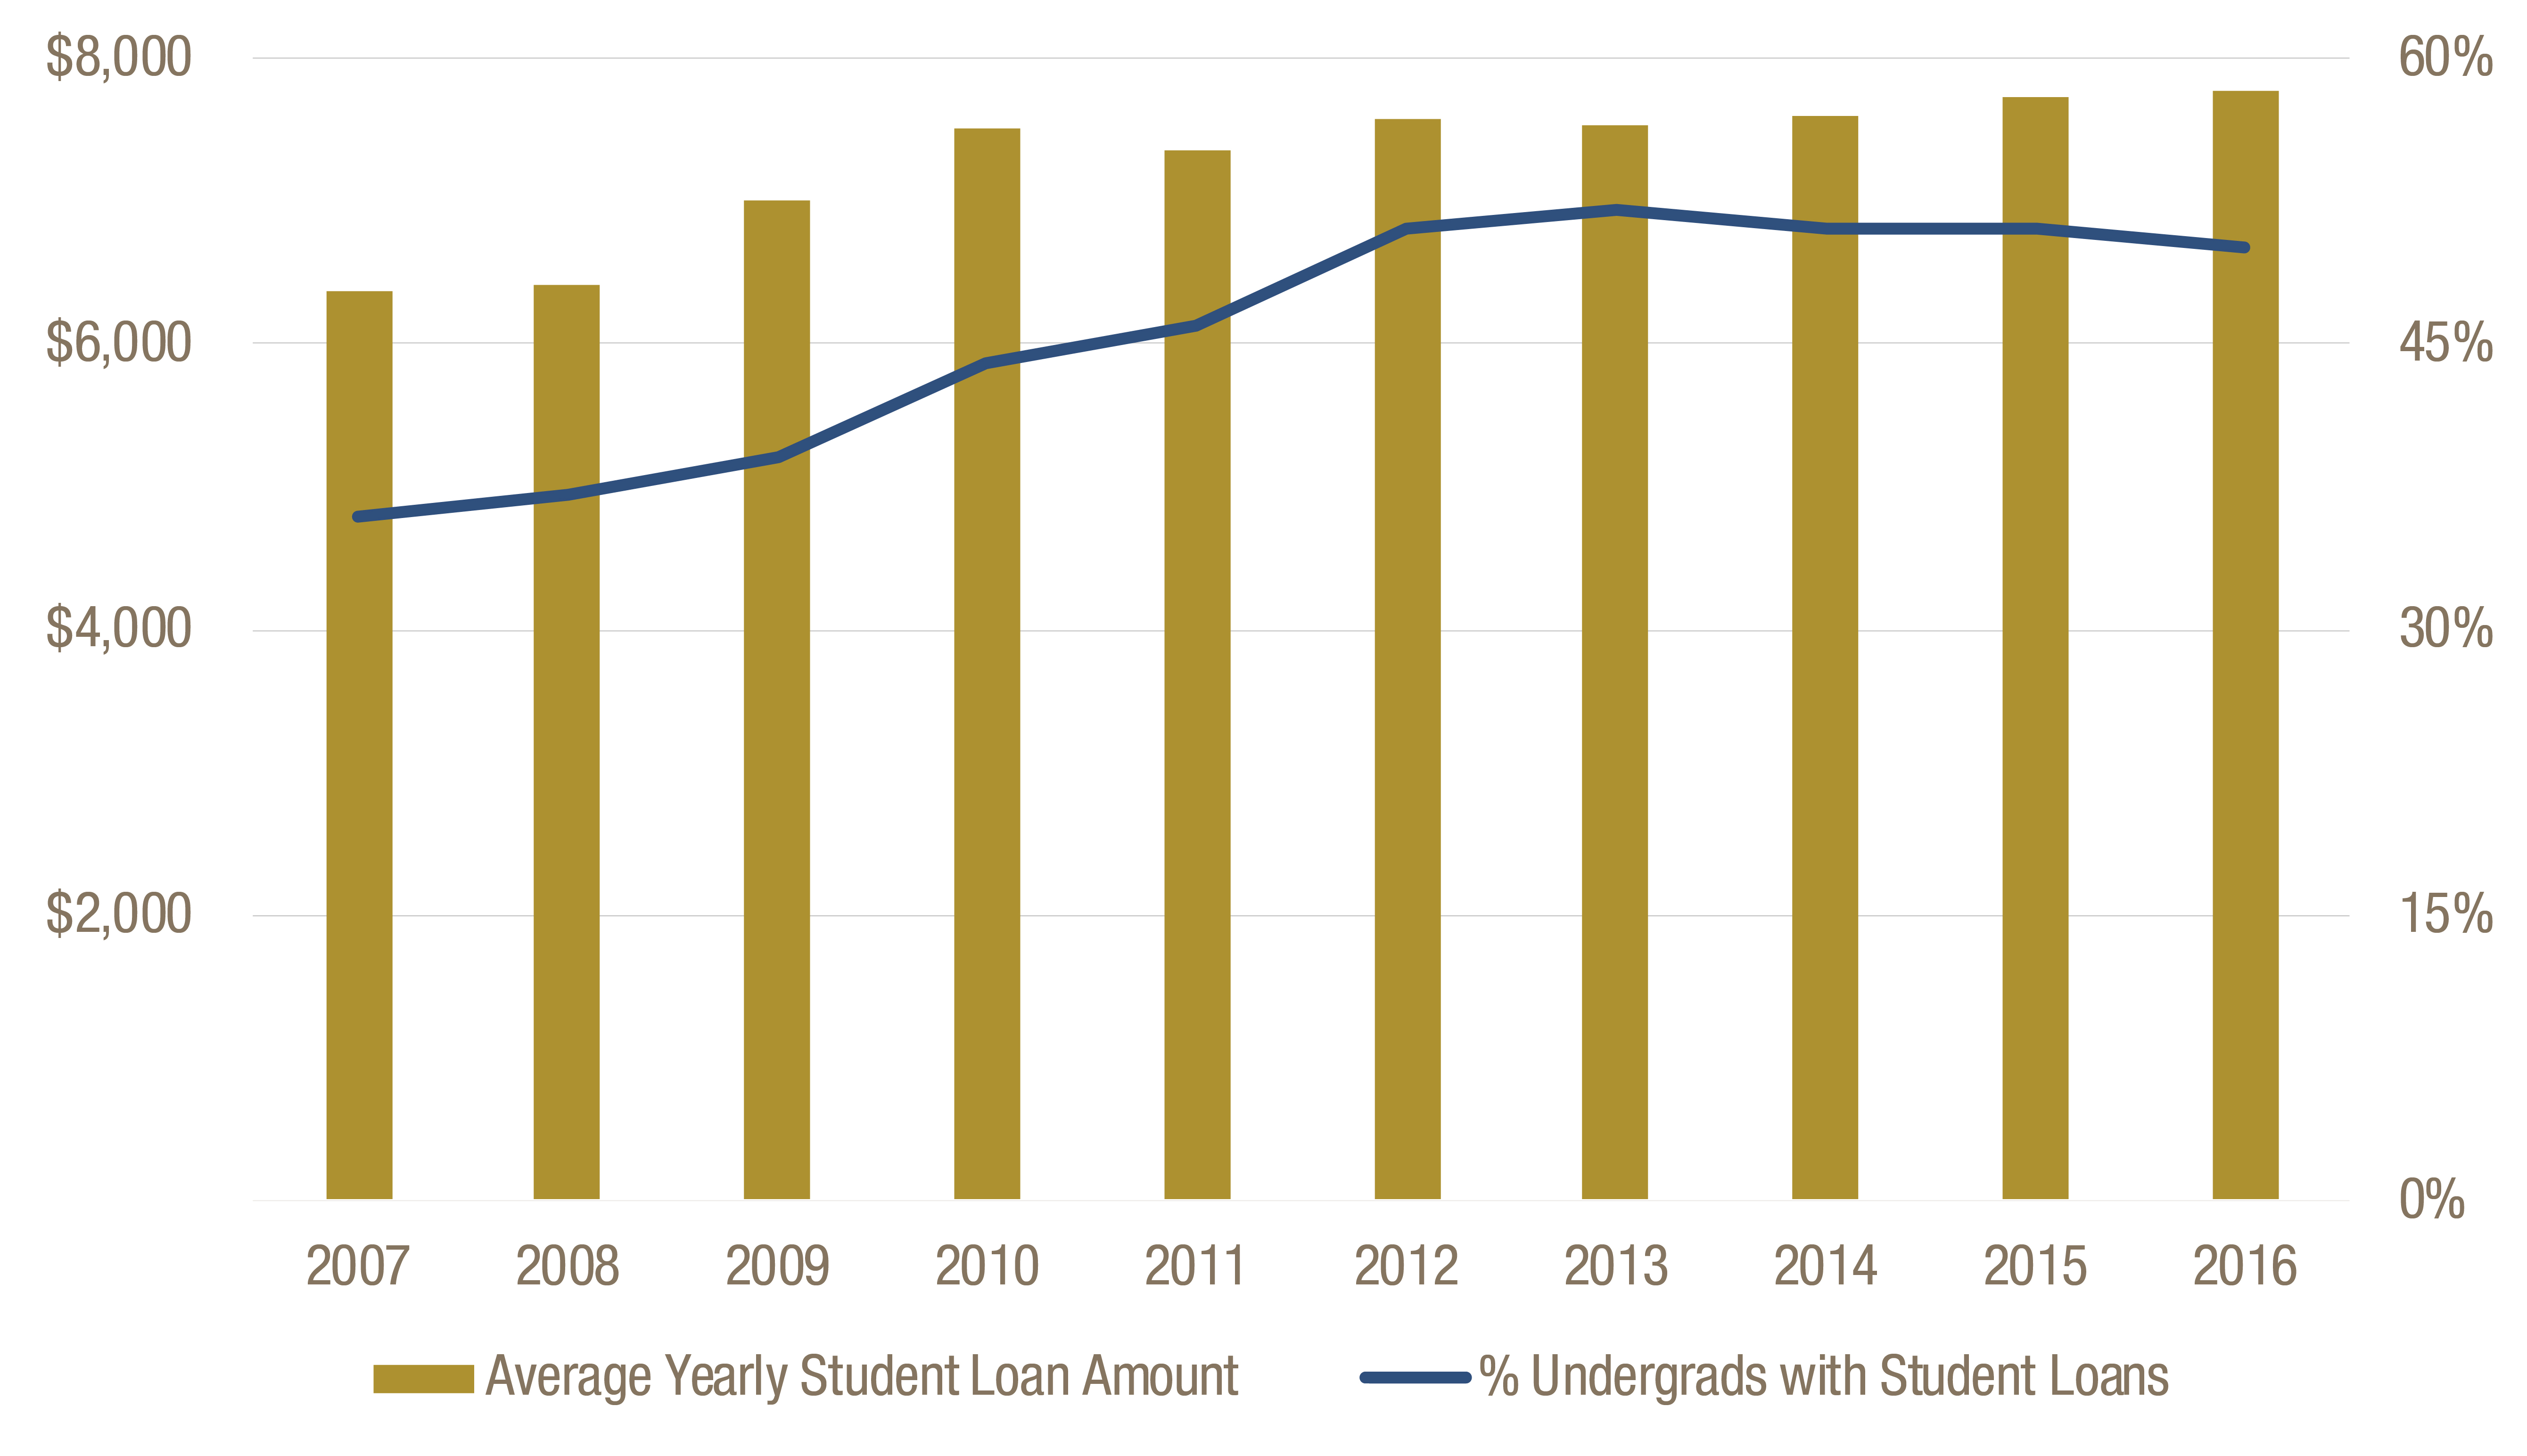
The share of students who use loans to finance their education surged during the recession, a period when tuition increased and lawmakers made cuts to the HOPE program. In 2007, 36 percent of undergraduate students in the university system carried student loans. By 2016, 50 percent did. Average single-year loan amounts also increased, to an inflation-adjusted $7,774 in 2016 from $6,362 in 2007.[10]
Students Relying More on Loans to Pay for College
Low-Income Students Hurt Most By Tuition Increases
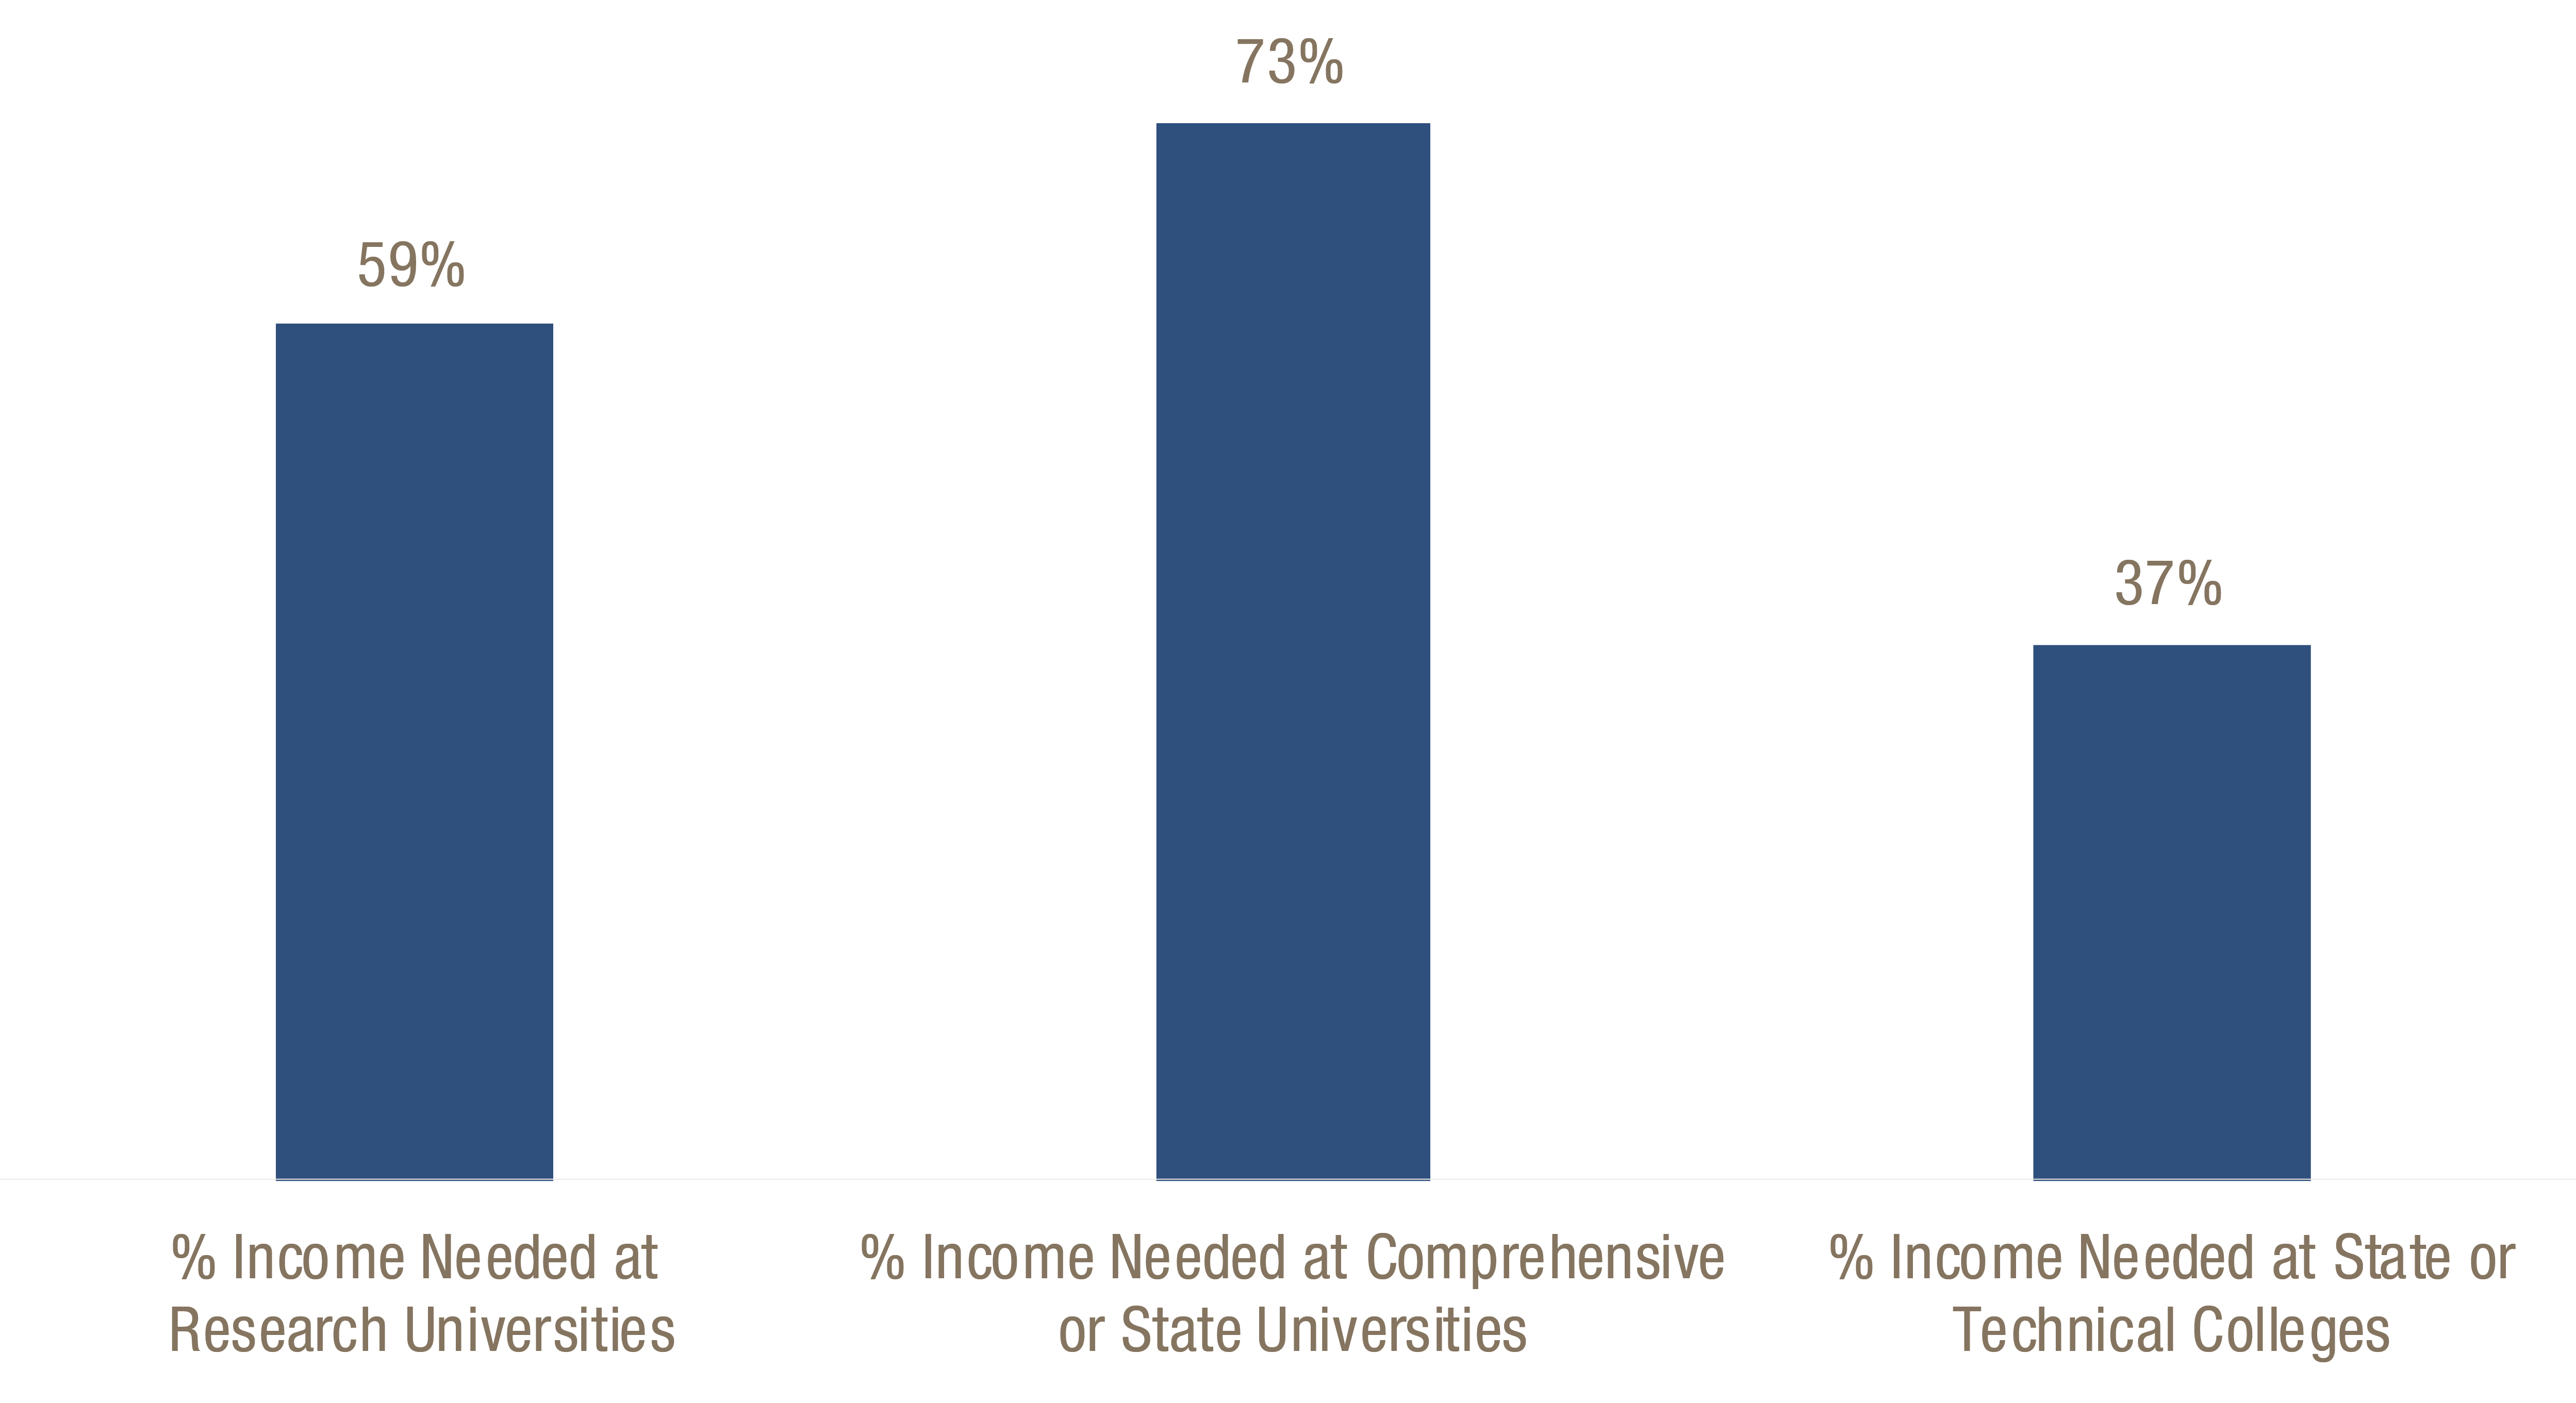
The median family income of a university system undergraduate who applied for financial aid is $40,484.[11] A quarter of families statewide have income less than $30,000. College is much less affordable for these lower-income students, according to analysis by the Southern Regional Education Board. The net price of a public, four-year college for these students, after accounting for financial aid, is more than half of family income. Even at lower-cost state and technical colleges, average net price is more than a third of these students’ incomes.[12]
Net Price of Four-Year College Is More than Half the Earnings of Low-Income Students
Net price as percentage of income for students with annual income under $30,000
The price of college has increased for students at all income levels. Students with the lowest-incomes in the university system endured the largest increases. Average net price for students with income less than $30,000 increased by $2,249, or 32 percent, between 2009-10 and 2014-15.[13]
Average Net Price for University System Students Grew Most for Low-Income Students
| Annual Income | University System Average Net Price 2009-10 | University System Average Net Price 2014-15 | % Change in Average Net Price |
| <$30,000 | $7,077 | $9,326 | 32% |
| $30,001-48,000 | $8,141 | $10,214 | 25% |
| $48,001-75,000 | $11,428 | $12,722 | 11% |
| $75,001-110,000 | $13,248 | $14,249 | 8% |
| >$110,000 | $13,381 | $14,514 | 8% |

Low-income students less likely to receive HOPE
State lawmakers made changes in 2011 that made it harder for students to get a full-tuition scholarship, requiring them to earn a higher GPA and reach certain benchmarks on the SAT or ACT exams. Students who do not qualify under the new terms but would have qualified for HOPE prior to 2011 receive a partial-tuition scholarship.
By splitting the HOPE program in this way, lower-income students are much less likely to receive full-tuition benefits. Only 21 percent of students receiving a full HOPE scholarship were also low-income and receiving the Pell Grant, according to an analysis of fall 2013 HOPE recipients.[14]
HOPE Reduces Net Price Most at Costliest Colleges, Leaves Many with High Costs and Loans
The four public research universities (University of Georgia, Georgia State, Georgia Tech and Augusta University) charge the highest tuition and fees, but students attending these schools do not pay the highest average price. That’s because these students are far more likely to receive state aid through HOPE scholarships. Twenty-one percent of students in research universities receive full-tuition benefits through the Zell Miller Scholarship, and another 39 percent receive partial-tuition benefits through the HOPE scholarship. (See Appendix A for data by college in university system.)
Few Students outside of Research Universities Receive Full-Tuition Benefits
| University System Sector | % Students Receiving HOPE Scholarship/Grant |
% Students Receiving Zell Miller Scholarship/Grant | Total % of Students Receiving HOPE/Zell Miller Grant |
| Research Universities | 39% | 21% | 60% |
| Comprehensive Universities | 37% | 8% | 45% |
| State Universities | 30% | 3% | 33% |
| State College | 18% | <1% | 18% |
| Technical Colleges | 43% | 13% | 56% |
Does HOPE Increase College Completion?Evidence shows that HOPE scholarships and grants increase completion rates, though most HOPE money is awarded to students who are likely to graduate without the program.[15] Still, HOPE does offer other benefits, such as keeping Georgia high school students within the state who might otherwise enroll out-of-state. It also acts an as incentive for high school students to improve their academic performance. Research on student aid programs that reduce tuition to zero show that these approaches effectively increase completion rates. Added student support enhance the benefits of free tuition. The ASAP program in New York City increased three-year graduation rates of community college students who needed developmental education from 22 to 40 percent. |
In addition to eliminating tuition costs to students, the program relied on a comprehensive package of student supports and strategies. Those included a full-time enrollment requirement, free public transportation, textbook access and additional advising, tutoring and career services.[16] Though the ASAP initiative required additional investment, the total cost per degree dropped.
Students in the four comprehensive universities (Georgia Southern, Kennesaw State, University of West Georgia and Valdosta State) pay the highest average price. In 2014-15, the average net price in these schools was more than $15,000.[17]
Students in Comprehensive Universities Pay Highest Average Net Price
Students attending comprehensive universities are also the most likely to carry loans.[18] Though research universities have the lowest share of undergraduate students with loans, they borrow the highest average amounts within an academic year.[19] The average loan amount taken out in one academic year represents nearly 20 percent of the family income of a typical undergraduate student.[20] (See Appendix B for loan amounts by college.)
Most Students at Comprehensive Universities Rely on Loans, Students in Research Universities Have Largest Loans
| University System Sector | Percentage of students with loans, 2015-16 | Average student loan amount borrowed during academic year, 2015-16 | Median family income of students applying for financial aid, 2015-16 | Average loan amount as percentage of median family income |
| Research Universities | 42% | $8,533 | $45,981 | 19% |
| Comprehensive Universities | 59% | $8,048 | $48,497 | 17% |
| State Universities | 55% | $8,012 | $37,007 | 22% |
| State College | 45% | $5,604 | $30,561 | 18% |
| TOTAL | 50% | $7,774 | $40,484 | 19% |

Recommendations
Ensuring higher education opportunity in Georgia is important because college is one of the best ways for people to move up the economic ladder. It acts as the critical link between Georgians and job opportunities. And colleges and universities are incubators for the state’s future workers, entrepreneurs and leaders.
Higher education budgets are vulnerable to economic downturns. During these times, families are asked to pay more, even as they struggle to make ends meet. Rising prices hurt the lowest-income students the most. And budget cuts to colleges and universities undercut a school’s ability to help the neediest students graduate.
The following principles and recommendations can guide investments to strengthen Georgia’s public higher education system.
-
Work to return higher education funding back to historical levels.
Over the past 30 years, Georgia drastically reduced its funding of public higher education. While state lawmakers once paid 75 percent of higher education costs, the state contribution is down to about 50 percent. That means colleges now must come up with about half the cost of educating students. The schools find the money by charging tuition and fees. Smaller state responsibility for higher education means higher prices for students.
The state restored some higher education funding since the recession. However, Georgia’s 2018 budget is short an inflation-adjusted $623 million for the university system if it were funded at the same per-student level as in 2008. If funded at the historically highest per-student levels of 2001, the budget would require an added $2.2 billion.
-
Designate a portion of the Revenue Shortfall Reserve to protect students against large tuition increases during state budget cuts.
Higher education programs are vulnerable during economic recessions. The downturns typically lead to large state budget cuts and enrollment growth. The state sets aside a rainy day fund to help maintain services and funding levels during downturns. The reserves did not protect higher education from large budget and HOPE cuts during the recession that started in 2007. To make matters worse, colleges raised tuition to make up for budget cuts while Georgia families were struggling the most with lost wages and unemployment.
To better prepare for the next economic downturn, the Legislature voted in 2010 to raise the cap on the state’s rainy day fund from 10 to 15 percent of the budget. To build on this positive step and further protect students against tuition hikes, the state can designate a small portion of reserves to avoid tuition increases during years of falling state revenues.
Maryland created the Tuition Stabilization Trust Account to keep tuition stable in years of decreasing revenues, with the goal of tying tuition and fee increases to changes in the state’s median family income. Legislation specifies money should be spent only to supplement general fund appropriations for the purpose of stabilizing tuition costs.
The Legislature can already appropriate reserve money for increased K-12 needs. K-12 formula funding is based on past enrollment numbers, and public schools can’t raise tuition revenue. Higher education budget requests are also based on past enrollment numbers. Colleges and universities rely on the flexibility of raising tuition to make up for any gaps. Using reserves to supplement funding would help keep students’ tuition bills from serving as the go-to source to balance budgets during hard economic times.
-
Develop a state aid program that responds to increased family financial need.
Even after accounting for federal financial aid, the price of college is more than half of average annual income for students who come from families earning less than $30,000, or a quarter of Georgia families. The cost is more than a third of an average student’s income at two-year and technical colleges.
Georgia is one of only two states in the country that does not offer state aid programs weighted to financial need. Though HOPE helps most students in higher-priced research universities, it supports a far smaller share at other colleges. Middle and high-income students are much more likely to qualify for full tuition aid through HOPE than lower-income students.
One simple approach to providing low-income students with financial aid is a need-based grant program. Other states and individual colleges also provide aid in the form of forgivable loans or work-study opportunities for low-income students. Funding for these initiatives can come through state appropriations, tuition and fee revenue, lottery proceeds, or matching funds between institutions, employers and the state.
Appendix A. HOPE and Zell Miller Scholarships by USG institution, Fall 2015
| Institution | % Undergrads with HOPE Scholarships | % Undergrads with Zell Miller |
Total – % Undergrads with HOPE or Zell Miller |
| University of Georgia | 46% | 33% | 79% |
| Georgia College & State University | 62% | 9% | 71% |
| Georgia Institute of Technology | 26% | 42% | 69% |
| Georgia Southern University | 40% | 4% | 44% |
| University of North Georgia | 39% | 5% | 44% |
| Georgia State University | 39% | 3% | 41% |
| University of West Georgia | 37% | 2% | 40% |
| Kennesaw State University | 36% | 3% | 39% |
| Augusta University | 33% | 6% | 39% |
| Dalton State College | 34% | 3% | 37% |
| Valdosta State University | 34% | 3% | 37% |
| Abraham Baldwin Agricultural College |
34% | 3% | 36% |
| Armstrong State University | 29% | 2% | 32% |
| Columbus State University | 29% | 2% | 31% |
| Georgia Southwestern State University |
27% | 3% | 30% |
| South Georgia State College | 28% | 1% | 30% |
| College of Coastal Georgia | 25% | 1% | 26% |
| Middle Georgia State University | 22% | 1% | 23% |
| Gordon State College | 22% | 1% | 23% |
| East Georgia State College | 21% | 0% | 21% |
| Georgia Gwinnett College | 20% | 1% | 21% |
| Georgia Highlands College | 20% | 1% | 21% |
| Albany State University | 20% | 0% | 20% |
| Savannah State University | 18% | 0% | 18% |
| Clayton State University | 17% | 1% | 17% |
| Fort Valley State University | 16% | 1% | 16% |
| Darton State College | 13% | 1% | 14% |
| Bainbridge State College | 11% | 0% | 11% |
| Georgia Perimeter College | 8% | 0% | 8% |
| Atlanta Metropolitan State College | 3% | 0% | 3% |
| University System Total | 31% | 7% | 38% |
Appendix B. Undergraduate Student Loans by USG institution, 2015-16
| Institution | Average Undergraduate Student Loan Amount | % Undergrads with Student Loans |
| Georgia Institute of Technology | $13,406 | 32% |
| Fort Valley State University | $9,624 | 88% |
| Savannah State University | $9,383 | 84% |
| University of Georgia | $9,243 | 38% |
| Georgia College & State University | $8,836 | 44% |
| Albany State University | $8,835 | 77% |
| Valdosta State University | $8,593 | 64% |
| University of West Georgia | $8,504 | 66% |
| Clayton State University | $8,342 | 67% |
| Armstrong State University | $8,046 | 58% |
| Georgia Southern University | $8,012 | 63% |
| Columbus State University | $7,789 | 57% |
| Middle Georgia State University | $7,766 | 51% |
| Kennesaw State University | $7,696 | 53% |
| Augusta University | $7,440 | 56% |
| Georgia Southwestern State University | $7,438 | 61% |
| Georgia State University | $7,303 | 46% |
| Darton State College | $6,398 | 58% |
| University of North Georgia | $6,317 | 39% |
| Gordon State College | $6,031 | 58% |
| Georgia Gwinnett College | $5,974 | 48% |
| South Georgia State College | $5,922 | 42% |
| Abraham Baldwin Agricultural College | $5,839 | 44% |
| College of Coastal Georgia | $5,688 | 46% |
| Dalton State College | $5,430 | 26% |
| Bainbridge State College | $5,320 | 45% |
| East Georgia State College | $5,160 | 51% |
| Georgia Highlands College | $4,249 | 32% |
| Atlanta Metropolitan State College | $3,630 | 39% |
| University System Total | $7,774 | 50% |
Appendix C. Tuition, Fees and Net Price by University System Institution
| Institution | Tuition and fees, 2016-17 |
Average Net Price, 2014-15 |
| Armstrong State University | $5,360 | $18,633 |
| Georgia College and State University | $9,202 | $17,609 |
| Kennesaw State University | $6,060 | $17,493 |
| Georgia Southern University | $6,273 | $16,445 |
| University of West Georgia | $6,143 | $14,565 |
| Fort Valley State University | $5,594 | $14,342 |
| Georgia State University | $8,974 | $14,134 |
| University of Georgia | $11,634 | $13,280 |
| Valdosta State University | $6,297 | $13,148 |
| Georgia Institute of Technology – Main Campus | $12,212 | $12,736 |
| Georgia Gwinnett College | $5,558 | $12,264 |
| Augusta University | $8,282 | $12,157 |
| Georgia Southwestern State University | $5,262 | $12,133 |
| Albany State University | $5,490 | $11,998 |
| College of Coastal Georgia | $3,821 | $11,903 |
| Columbus State University | $6,031 | $10,946 |
| Clayton State University | $5,340 | $10,862 |
| Gordon State College | $3,974 | $10,500 |
| University of North Georgia | $4,397 | $10,299 |
| Savannah State University | $5,644 | $10,282 |
| Middle Georgia State University | $3,890 | $9,313 |
| South Georgia State College | $3,211 | $8,365 |
| Abraham Baldwin Agricultural College | $3,453 | $8,069 |
| Darton State College | $3,395 | $7,166 |
| Georgia Military College | $6,128 | $6,950 |
| Georgia Highlands College | $3,245 | $6,683 |
| Georgia State University-Perimeter College | $3,261 | $6,285 |
| Dalton State College | $3,503 | $5,957 |
| East Georgia State College | $3,067 | $5,744 |
| Atlanta Metropolitan State College | $3,250 | $4,192 |
| Bainbridge State College | $3,227 | $2,975 |
Appendix D. Tuition, Fees and Net Price by Technical College
| Institution | Tuition and Fees, 2016-17 |
Average Net Price, 2014-15 |
| Coastal Pines Technical College | $4,785 | $10,087 |
| Augusta Technical College | $2,704 | $8,525 |
| Southern Crescent Technical College | $2,758 | $8,373 |
| Gwinnett Technical College | $2,796 | $8,015 |
| Georgia Piedmont Technical College | $2,850 | $7,695 |
| Columbus Technical College | $2,704 | $7,045 |
| North Georgia Technical College | $2,734 | $6,522 |
| Athens Technical College | $2,794 | $6,446 |
| South Georgia Technical College | $2,744 | $6,130 |
| Ogeechee Technical College | $2,872 | $5,821 |
| Lanier Technical College | $3,169 | $5,744 |
| Savannah Technical College | $2,704 | $4,523 |
| Southeastern Technical College | $2,784 | $4,167 |
| West Georgia Technical College | $2,764 | $4,165 |
| Georgia Northwestern Technical College | $2,764 | $3,841 |
| Atlanta Technical College | $2,756 | $2,948 |
| Chattahoochee Technical College | $2,746 | $2,894 |
| Central Georgia Technical College | $2,714 | $2,756 |
| Wiregrass Georgia Technical College | $2,744 | $2,353 |
| Southern Regional Technical College | $2,654 | $2,323 |
| Albany Technical College | $2,654 | $1,014 |
| Oconee Fall Line Technical College | $2,624 | $636 |
Endnotes
[1] GBPI analysis of U.S. Department of Education, National Center for Education Statistics, Integrated Postsecondary Education Data System. GBPI analysis of Georgia public institutions, 2009-2015 average net price data. Average net price is the total cost of attendance less the average amount of aid. Net price calculated for full-time, first-time undergraduates paying in-state tuition who were awarded grant or scholarship aid.
[2] GBPI analysis of Georgia’s AFY budgets 2001-2017; FY 2018 Budget (HB44). University System of Georgia, Fall semester enrollment reports 2006-2016.
[3] Georgia Department of Audits and Account. (2016). Board of Regents: Requested information on higher education cost drivers. Retrieved from https://www.audits.ga.gov/rsaAudits/loadRSAAudits.aud on March 2, 2017
[4] Study Committee on Public Higher Education Finance. (September 1982). Formula for Excellence: Financing Georgia’s University System in the ‘80s: Final Report. Atlanta, GA.
[5] Deming, D.J., & Walters, C.R. (2017). The impacts of price and spending subsidies on U.S. postsecondary attainment. Retrieved from https://scholar.harvard.edu/files/ddeming/files/demingwalters_higheredspending_jan2017.pdf on June 29, 2017.
[6] GBPI analysis of FY 2006-2016 data from Georgia Student Finance Commission. Received via email June 22, 2017.
[7] U.S. Department of Education, National Center for Education Statistics, Integrated Postsecondary Education Data System. GBPI analysis of Georgia public institutions, 2009-2015 tuition and fees data. Average in-state tuition and fees for full-time, first-time undergraduate students for the full academic year.
[8] GBPI analysis of U.S. Department of Education, National Center for Education Statistics, Integrated Postsecondary Education Data System. GBPI analysis of Georgia public institutions, 2009-2015 average net price data. Average net price is the total cost of attendance less the average amount of aid. Net price calculated for full-time, first-time undergraduates paying in-state tuition who were awarded grant or scholarship aid.
[9] Technical College System of Georgia. End-of-Year Enrollment Reports, Annual Reports 1999-2016, Retrieved on May 16, 2017 from https://kms.tcsg.edu/DPR/ReportsResearch/SystemSum.aspx. Includes enrollment in technical division of Bainbridge State College.Between 2011 and 2012, enrollment reporting changed from a quarter- to semester-based academic calendar.
[10] Data from University System of Georgia. Loan amount borrowed within one academic year by undergraduate students. Includes, federal, state, institutional and private loans where institutions must validate enrollment for students to receive loans. Other private loans and credit card debt may not be included.
[11] Data from University System of Georgia.
[12] Southern Regional Education Board. (July 2017). Georgia College Affordability Profile. https://www.sreb.org/publication/georgia
[13] GBPI analysis of U.S. Department of Education, National Center for Education Statistics, Integrated Postsecondary Education Data System. GBPI analysis of Georgia public institutions, 2009-2015 average net price data. Average net price is the total cost of attendance less the average amount of aid. Net price calculated for full-time, first-time undergraduates paying in-state tuition who were awarded grant or scholarship aid.
[14] Suggs, C. (2016). Troubling gaps in HOPE point to need-based aid solutions. Georgia Budget and Policy Institute. Retrieved from https://gbpi.org/2016/gaps-in-hope-point-to-need-based-aid/ on March 20, 2017.
[15] Dynarski, S. (2008). Building the stock of college-educated labor. The Journal of Human Resources, 43 (3), 576-610. Retrieved on June 297, 2017 from http://www.jstor.org/stable/40057360
[16] Scrivener, et.al. (2015). Doubling graduating rates: Three-year effects of CUNY’s Accelerated Study in Associate Programs (ASAP) for developmental education students. MDRC. Retrieved on June 29, 2017 from http://www.mdrc.org/project/evaluation-accelerated-study-associate-programs-asap-developmental-education-students#overview
[17] U.S. Department of Education, National Center for Education Statistics, Integrated Postsecondary Education Data System. GBPI analysis of Georgia public institutions, 2009-2015 tuition and fees data. Average in-state tuition and fees for full-time, first-time undergraduate students for the full academic year.
[18] GBPI analysis of data from University System of Georgia. Received via email July 10, 2017.
[19] GBPI analysis of data from University System of Georgia. Received via email July 10, 2017.
[20] GBPI analysis of data from University System of Georgia